DP0.2 Data Products
The DESC DC2 Data Set
DP0 is based on the the simulated, Legacy Survey of Space and Time (LSST)-like images generated by the Dark Energy Science Collaboration (DESC) for their Data Challenge 2 (DC2; arXiv:2010.05926). DP0 only uses the 300 deg2 of DC2 images that were simulated for five years of the LSST’s wide-fast-deep component (WFD; also called the main survey) with a baseline cadence (i.e., a fiducial observing strategy). For more information about the LSST regions and cadence see Ivezic et al. (2019).
Simulated Objects and Images:
The DC2’s WFD simulated images include galaxies (with large-scale structure), Type Ia supernovae, and stars (10% of which are variable).
Variable stars have type applyRRly (periodic variables such as RR Lyrae and Cepheids);
MLT (non-periodic, such as microlensing events, flaring M-dwarfs, cataclysmic variables); and
kplr (stars with no definitive variability class whose variability is modeled after Kepler lightcurves).
DP0.2 does not include AGN, strong lenses, solar system objects, non-Ia extragalactic transients, or diffuse features (e.g., tidal streams, intracluster light). The DESC simulated the DC2 images using the imSim package.
Image Processing: Rubin staff processed the DESC’s simulated DC2 images with Version 23 of the LSST Science Pipelines, and produced the images and catalogs that comprise the DP0.2 data release.
DP0.2 Data Products Definition Document (DPDD)
The DC2 data set is being made available for use on a shared-risk basis, and the LSST Science Pipelines which produced these images and catalogs are in active development.
Future data previews and Operations-era LSST data releases will produce images and catalogs that more closely resemble the plan laid out in the Data Products Definitions Document (DPDD). Several of the future data products (e.g., specific table columns) that are listed in the DPDD are not available for DP0.
Images
The three main types of images available for DP0.2 are processed visit images, coadded images, and difference images. These three are discussed in detail in the paragraphs below the table, which lists the image types (and their variants and/or subtracted backgrounds) that most users will find suitable for their science needs.
Butler DatasetType |
Minimum |
Description |
|---|---|---|
|
visit, detector |
Processed visit image with the background subtracted. |
|
visit, detector |
The background subtracted from the |
|
tract, patch, band |
The deep stack of the |
|
tract, patch, band |
The deep stack of the |
|
tract, patch, band |
The background subtracted from |
|
tract, patch, band |
The deep stack of the |
|
visit, detector |
The template image used for difference image analysis. |
|
visit, detector |
The difference image resulting from difference image analysis. |
The LSST Science Pipelines documentation discusses the concept of a “dataId”.
Processed Visit Image (PVI; calexp): A fully-qualified LSST image from a single visit (in other words, a single pointing) that includes the science pixel array, a quality mask, and a variance array, in addition to a PSF characterization and metadata (including calibration metadata) about the image. PVIs are stored with the background already subtracted. A single CCD of a PVI is called a “calexp”.
There are many associated data products that are accessible alongside PVIs. These include the background (“calexpBackground”) that was subtracted from the “calexp”, which can be retrieved separately. Each PVI also has an associated mask plane that encodes quality and other information about each pixel, a WCS solution to be used in converting between pixel and sky coordinates, a photometric calibration object to be used in converting between fluxes and magnitudes for astronomical sources, and a model of the point-spread function (PSF) at each position on the image.
Coadded Image (deepCoadd): An image that is the combination of multiple input images, often referred to as a “coadd” or a “deepCoadd”. The input images have been aligned to a common projection and pixel grid; corrected to the same photometric scale, zero-point, and point-spread function (PSF); and had bad pixels, artifacts, and transient and variable object flux removed prior to combination. Coadds are stored with the non-astrophysical background already subtracted. As with PVIs, the coadds also have associated data products including the background model that has been subtracted, the mask and variance planes associated with the image, a WCS solution, photometric calibration, and a PSF model.
Coadd images are divided into “tracts” (a spherical convex polygon) and tracts are divided into “patches” (a quadrilateral sub-region, with a size in pixels chosen to fit easily into memory on desktop computers, about the same size as a “calexp”).
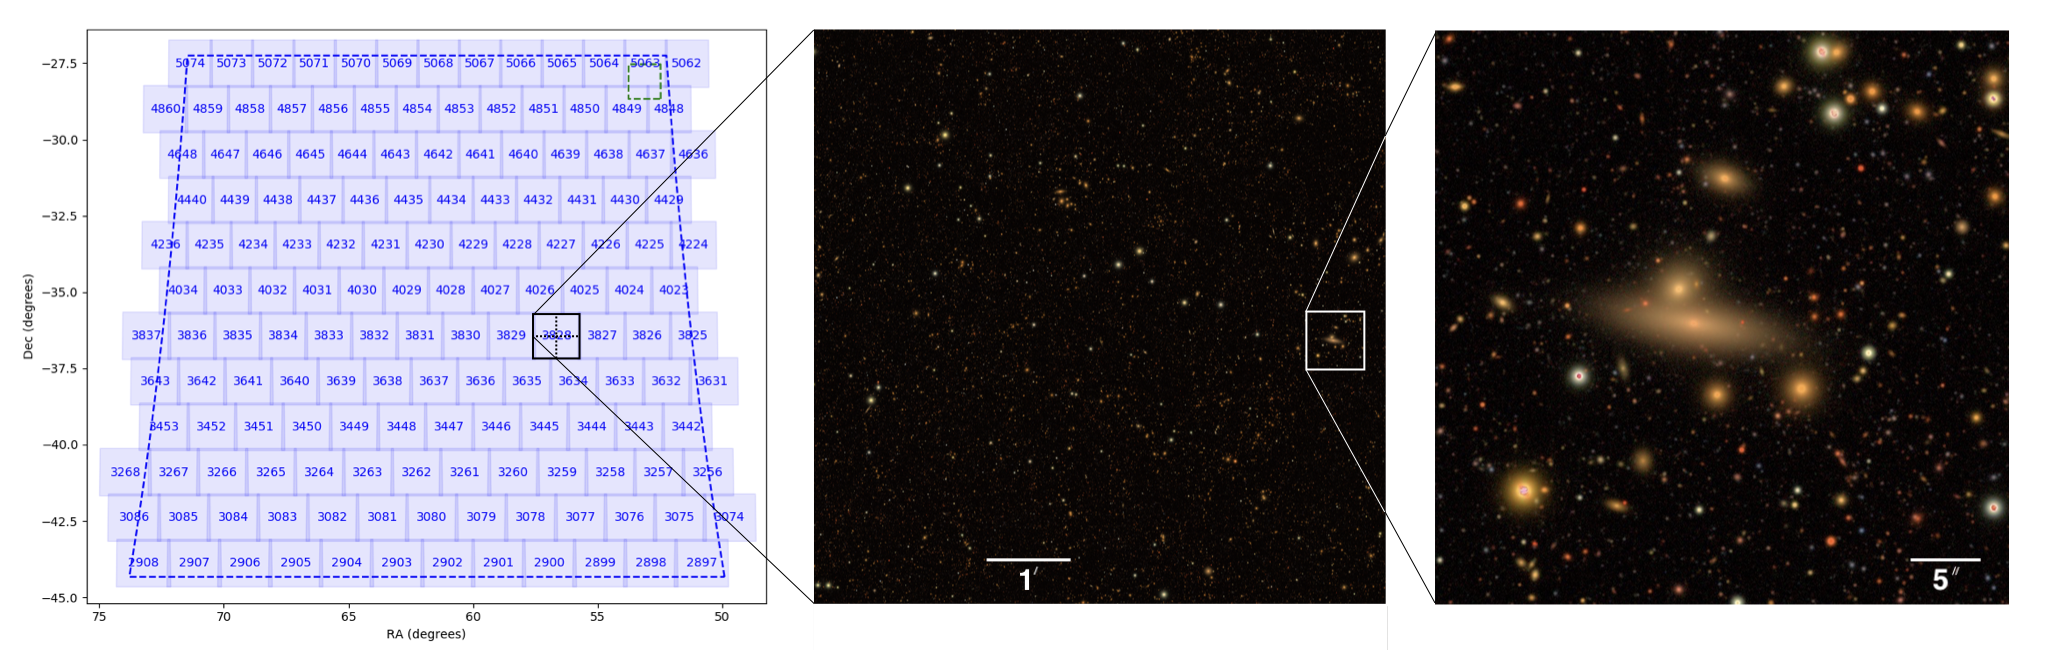
Figure 15 from The LSST DESC DC2 Simulated Sky Survey, showing the simulated WFD region divided into tracts. The center image is one tract quadrant, and the right image one hundredth the area of the tract quadrant. Patches are larger than the right image, as described in the DESC’s paper: “each tract is composed of 7 × 7 patches, and each patch is 4,100 × 4,100 pixels with a pixel scale of 0.2 arcsec”.
Difference Image: A PVI which has had a template image subtracted from it. Any source detected in a difference image represents the time-variable flux component of the astrophysical object.
Template images are, for DP0.2, built from the top one-third best seeing visits from all 5 years of the DC2 simulation. This is not representative of the future LSST data products; the plan is for templates applied to a given year of data to be built from images obtained the year before, and for the coaddition process to take care to remove transient or fast moving objects (see Section 3.4.3 of the DPDD). It is important to note that because of how the DP0.2 templates were built, there is often transient flux in the template images, which leads to negative flux offsets in the measured difference-image fluxes. Work to help users identify, quantify, and correct for this issue when using the time-domain data products for DC2 Type Ia supernovae is underway. The documentation and tutorials will be updated in the future, and in the meantime please reach out to Melissa Graham.
In the Butler, find difference exposures as “goodSeeingDiff_differenceExp”, and the templates as “goodSeeingDiff_templateExp”.
Catalogs
Source detection, measurement, and characterization have been run on the PVIs, coadds, and difference images to generate catalog data. Catalog data are accessible with the Table Access Protocol (TAP) service via the Portal or Notebook Aspect, and with the Butler via the Notebook Aspect.
DP0.2 Table Schema: The column names, units, and descriptions of the DP0.2 catalogs listed in the table below are all available via the DP0.2 schema browser.
DP0.2 Database Sharding: On disk, the catalog tables are sharded by coordinate (RA, Dec). This can be thought of as the database being divided up by spatial region (shard) and distributed across multiple servers. Queries that include spatial constraints which minimize the number of shards that have to be searched through will be much faster than queries which have no (or very wide) spatial constraints.
DP0.2 Table Indices:
The three columns, objectId, diaObjectId, and sourceId, can be thought of as columns that encode information about which shard the object can be found in.
These columns appear in multiple tables (e.g., the objectId appears in the Object table but also in the ForcedSource table).
Queries that provide constraints on these columns are executed much faster, because they also minimize the number of shards that have to be accessed.
TAP Name (Butler Name) |
Description |
|---|---|
Object (objectTable) |
Astrometric and photometric measurements for objects detected in coadded images (990 columns). |
Source (sourceTable) |
Astrometric and photometric measurements for sources detected in the individual PVIs (143 columns). |
ForcedSource (forcedSourceTable) |
Forced photometry on the individual PVIs at the locations of all detected objects (38 columns). |
DiaObject (diaObjectTable_tract) |
Derived summary parameters for DiaSources associated by sky location, including lighcurve statistics (137 columns). |
DiaSource (diaSourceTable) |
Astrometric and photometric measurements for sources detected in the difference images (66 columns). |
ForcedSourceOnDiaObject (forcedSourceOnDiaObjectTable) |
Forced photometry on the individual PVIs at the locations of all DiaObjects (35 columns). |
Visit (visitTable) |
Individual visit information, including band, airmass, exposure time, and so on (15 columns). |
CcdVisit (ccdVisitTable) |
Individual CCD (detector) information, including measured seeing, sky background, and zeropoint (30 columns). |
MatchesTruth (none; use TAP) |
Matches between TruthSummary and Object tables, including match statistics (8 columns). |
TruthSummary (none; use TAP) |
Summary properties of objects from the DESC DC2 truth catalog, as described in arXiv:2101.04855 (27 columns). |
Recommendation to include spatial constraints:
It is recommended to always start with spatial constraints for a small radius and then expand the search area.
Qserv stores catalog data sharded by coordinate (RA, Dec).
ADQL query statements that include constraints by coordinate do not requre a whole-catalog search,
and are typically faster (and can be much faster) than ADQL query statements which only include constraints for other columns.
Use either an ADQL Cone Search or a Polygon Search for faster queries.
Use of column constraints, or WHERE ... BETWEEN statements, to set boundaries on RA and Dec is not recommended.
Recommended search parameter “detect_isPrimary = True”:
A good default search query parameter for the Object, Source, and ForcedSource catalogs is to set detect_isPrimary = True.
The detect_isPrimary parameter is True if a source has no children, is in the inner region of a coadd patch, is in the inner region of a coadd tract, and is not “detected” in a pseudo-filter.
Setting detect_isPrimary to True will remove any duplicates, sky objects, etc.
See this documentation on filtering for unique, deblended sources with the detect_isPrimary flag for more information.
Multiple similar Butler catalogs, which contain the same data but are slightly differently named and differently formatted, can be found by querying the collections in the Butler registry. Some tables require different types of inputs: for example, “diaSourceTable” can be queried with a dataId that includes the visit, whereas “diaSourceTable_tract” can be queried with a dataId that includes the tract number. The table below lists the catalogs most likely to be most useful to most people. Note that in the future, for real LSST data releases, this level of redundancy in the catalog data would not be served.
Principal Columns: In this context, ‘principal columns’ means the columns that a basic table query (or most queries) would want to retrieve; in other words, the default columns. For convenience, Rubin Observatory staff have identified the principal columns which are most likely to be useful. These principal columns will be pre-selected in the Table View of the RSP’s Portal Aspect.
For photometry of point sources:
PSF model fluxes are generally recommended, but there could be issues for objects near the edges of CCDs. For single-visit (source) photometry, it is recommended to use psfFlux for the flux, psfFluxErr for the flux error, and psfFlux_flag for culling sources with poorly determined PSF model fluxes. For coadd (object) photometry, it is recommended to use <band>_psfFlux for the flux, <band>_psfFluxErr for the flux error, and <band>_pixelFlags_inexact_psfCenter to identify objects which may contain sources with poorly determined PSF photometry. (Note: the object <band>_inputCount value can help indicate how strong this effect may be; the larger <band>_inputCount, the smaller the effect.)
For photometry of extended sources:
<band>_cModelFlux is a reasonable choice for galaxy fluxes, but the Gaussian aperture fluxes are generally preferred for galaxy colors. Of the many Gaussian aperture fluxes, the <band>_gaap1p0Flux (the sigma=1.0-arcsec Gaussian aperture) seems to be a reasonable choice. Currently, the Gaussian optimal aperture (<band>_gaapOptimalFlux) tends to fail often and is not generally recommended. For further information on Gaussian aperture photometry, please consult Kuijken (2008), Kuiken et al. (2015), and/or Konrad Kuijken’s talk at the March 2020 Rubin Observatory Algorithms Workshop (link).
Truth catalog data:
The TruthSummary and MatchesTruth tables are accessible via TAP (and not the Butler)
as demonstrated in DP0.2 tutorial notebook “DP02_08_Truth_Tables.ipynb”.
Additional truth data has been made available by DESC as parquet files in the shared disk space in the RSP
at data.lsst.cloud, with access demonstrated in this
DP0.2 contributed notebook.
Find more information about the matching algorithm in Matching the Object and Truth Tables.
Survey Property Maps
Several types of survey property maps are generated by the Rubin Science Pipelines. They take the form of sparse HEALPix maps, where the survey property at each spatial pixel is identified by a pixel number/pixel value pair. Each map represents a healsparse map containing the value of an individual survey property, for a given band. Note that the DCR maps are proportionality maps; that is, the expected effect will be proportional to the value in the map with an arbitrary/empirically derived constant of proportionality. All survey property maps are available via the Butler. Find a demonstration of how to retrieve, display, and analyze survey property maps in the tutorial notebook named Survey_Property_Maps.
Name |
Description |
|---|---|
deepCoadd_dcr_ddec_consolidated_map_weighted_mean |
Average effect of differential chromatic refraction (DCR) in declination direction. |
deepCoadd_dcr_dra_consolidated_map_weighted_mean |
Average effect of differential chromatic refraction (DCR) in right ascension direction. |
deepCoadd_dcr_e1_consolidated_map_weighted_mean |
Average effect of differential chromatic refraction (DCR) on psf e1. |
deepCoadd_dcr_e2_consolidated_map_weighted_mean |
Average effect of differential chromatic refraction (DCR) on psf e2. |
deepCoadd_exposure_time_consolidated_map_sum |
Total exposure time (seconds). |
deepCoadd_psf_e1_consolidated_map_weighted_mean |
Weighted mean of psf e1 of images used to make the deepCoadd. |
deepCoadd_psf_e2_consolidated_map_weighted_mean |
Weighted mean of psf e2 of images used to make the deepCoadd. |
deepCoadd_psf_maglim_consolidated_map_weighted_mean |
PSF Flux 5-sigma magnitude limit (AB). |
deepCoadd_psf_size_consolidated_map_weighted_mean |
Weighted mean of psf size of images used to make the deepCoadd (pixels). |
deepCoadd_sky_background_consolidated_map_weighted_mean |
Weighted mean of sky background of images used to make the deepCoadd (ADU). |
deepCoadd_sky_noise_consolidated_map_weighted_mean |
Weighted mean of sky noise of images used to make the deepCoadd (ADU). |