04. How to view query results
RSP Aspect: Portal
Contact authors: Greg Madejski and Melissa Graham
Last verified to run: 2025-02-04
Targeted learning level: beginner
Introduction: This tutorial demonstrates how to view and interact with the results of a simple Portal query.
1. Execute a query. Go to the Portal’s DP0.2 Catalogs tab, switch to the ADQL interface, and execute the query below.
SELECT coord_dec, coord_ra, detect_isPrimary, refExtendedness,
       u_cModelFlux, g_cModelFlux, r_cModelFlux,
       i_cModelFlux, z_cModelFlux, y_cModelFlux
FROM dp02_dc2_catalogs.Object
WHERE CONTAINS(POINT('ICRS', coord_ra, coord_dec),
      CIRCLE('ICRS', 62, -37, 0.167)) =1
      AND (detect_isPrimary =1 AND refExtendedness =1
           AND u_cModelFlux >360 AND g_cModelFlux >360
           AND r_cModelFlux >360 AND i_cModelFlux >360
           AND z_cModelFlux >360 AND y_cModelFlux >360)
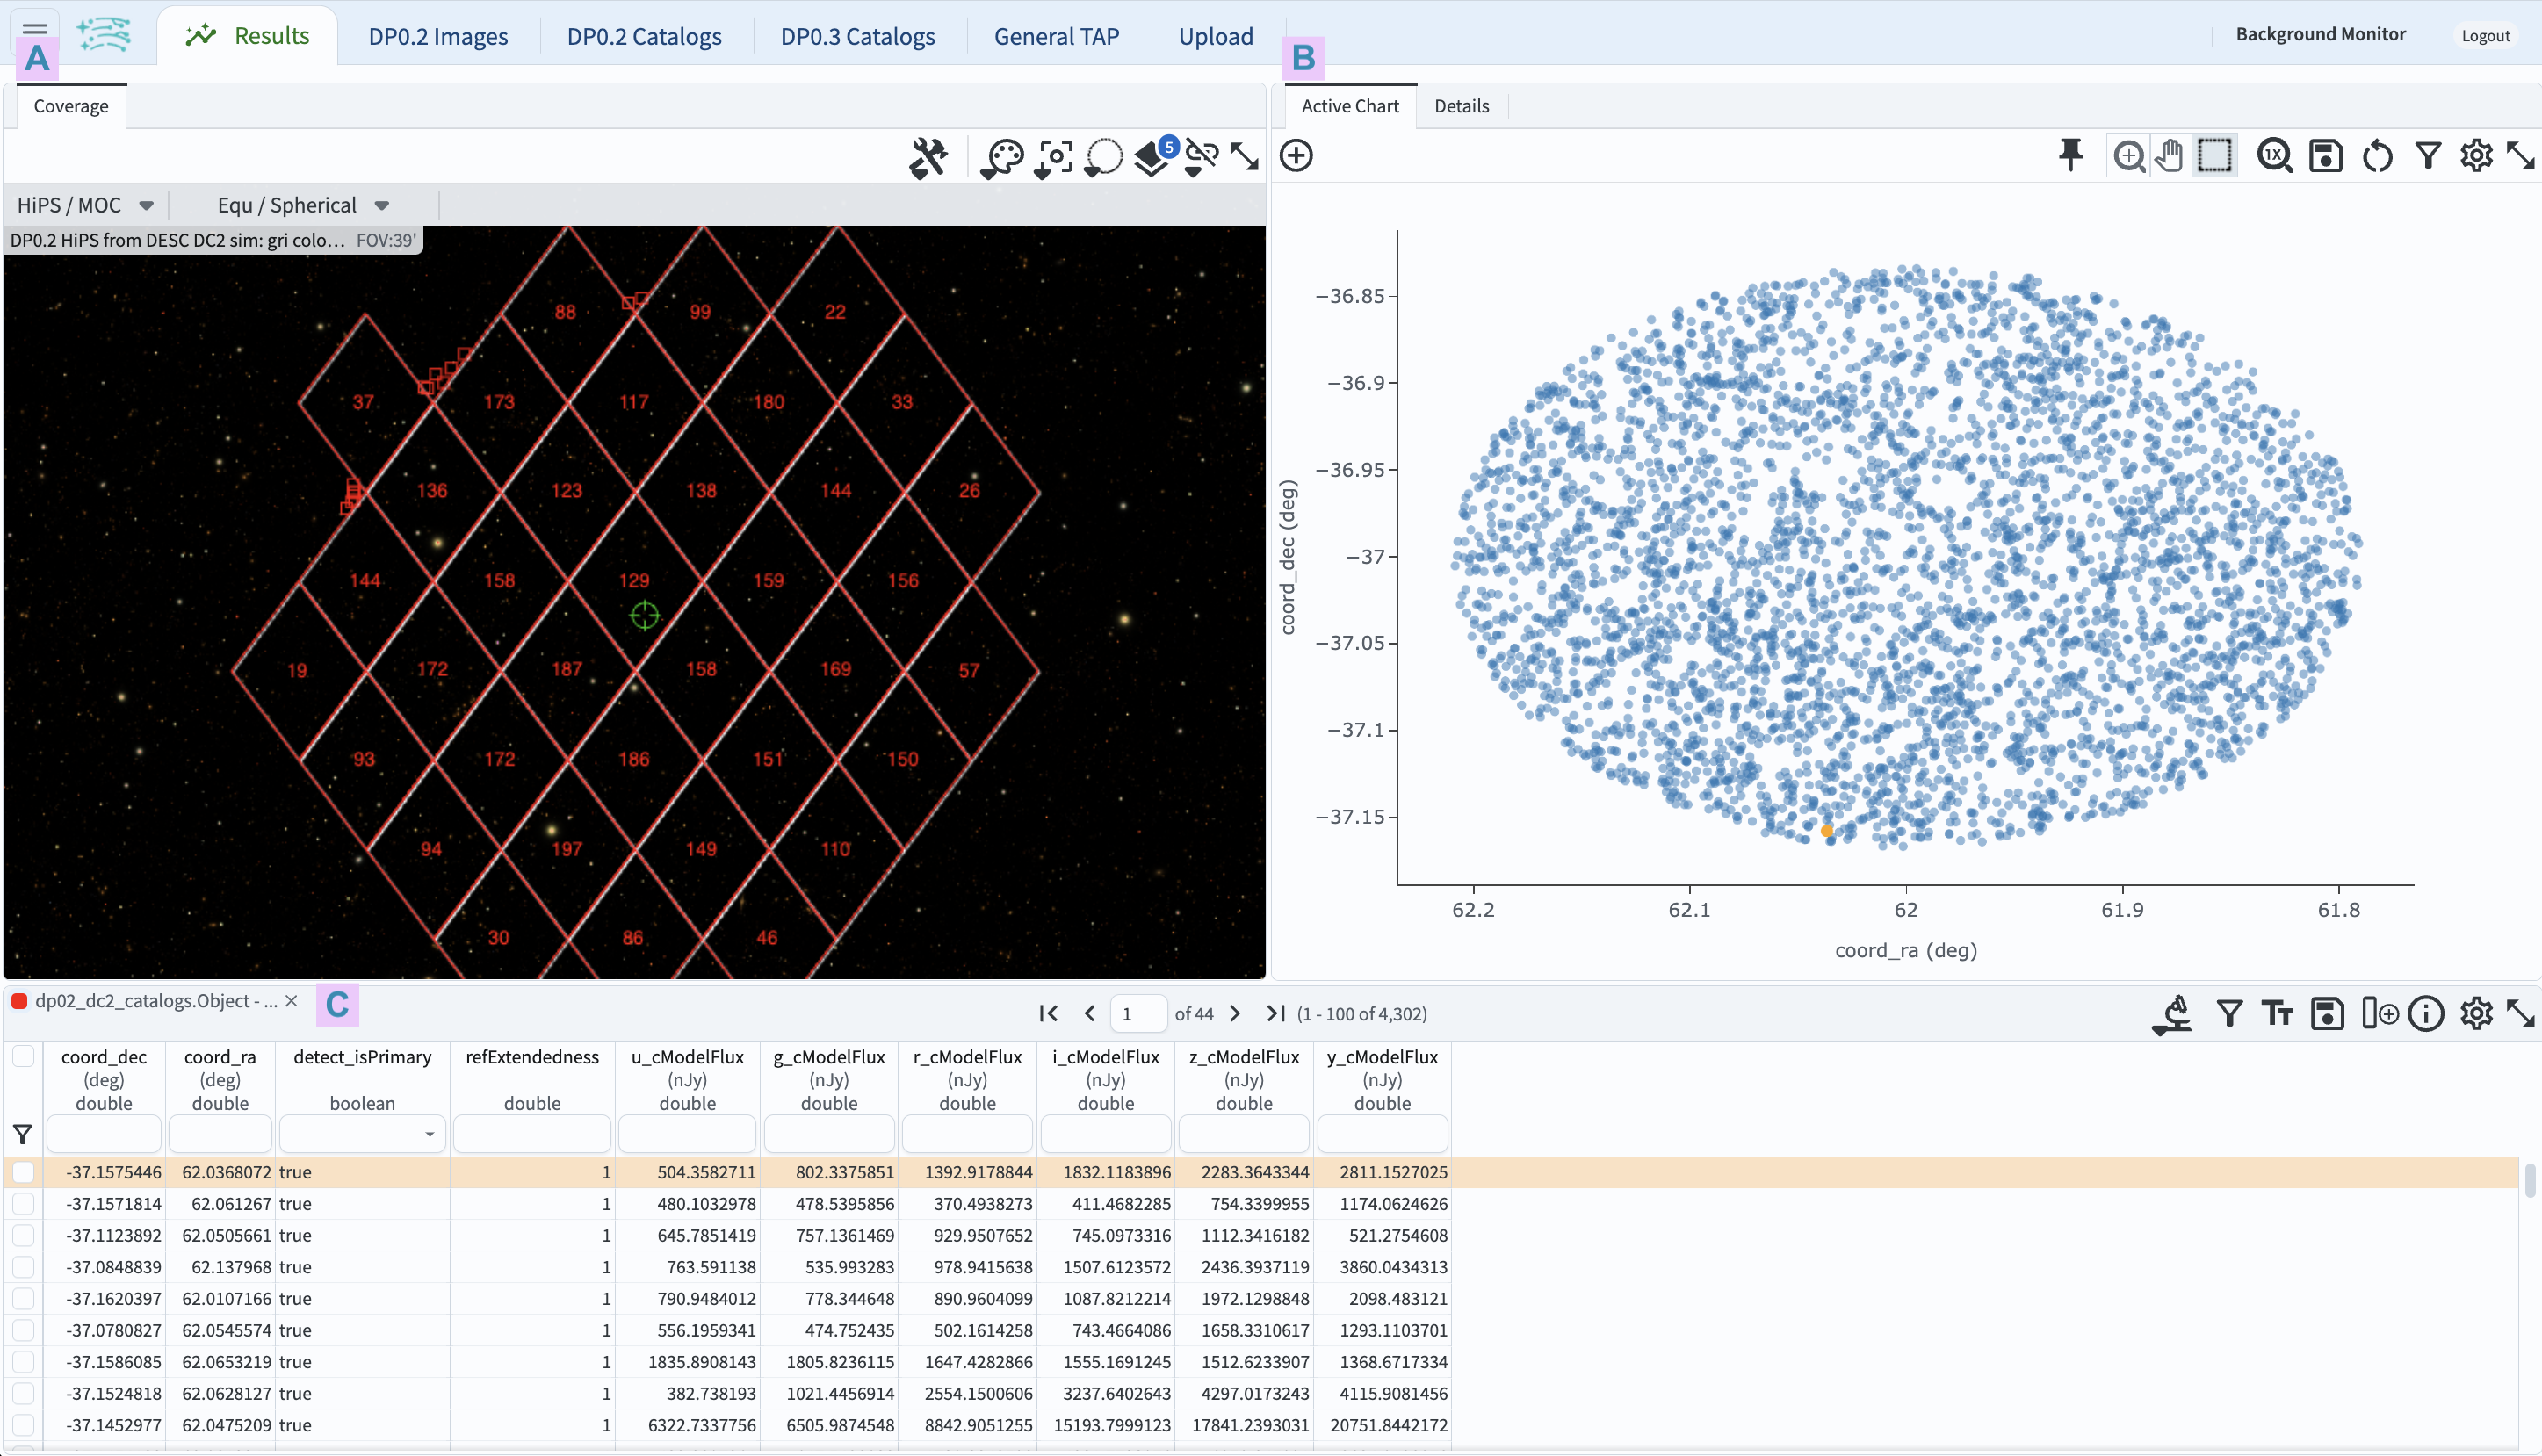
2. Review the Results tab layout. The default layout of the Results tab is shown in Figure 1.

Figure 1: The Results tab after a query has been executed defaults to a screens split three ways: coverage map at upper left, default plot at uppr right, and the tabular data below.
3. Coverage chart (A in Figure 1). The default view is a HEALpix grid showing the number of returned objects per grid region. Small red squares mark individual objects outside the grid. The background is a color HiPS map of the DP0.2 deeply coadded images.
4. Active chart (B in Figure 1). The default plot will be the first two columns of the returned data table. In Figure 1, this is the Declination coordinate on the y-axis and the Right Ascension coordinate on the x-axis. This plot will switch to a two-dimensional histogram if so many objects are returned that individual points cannot be distinguished.
5. Table results (C in Figure 1). A scrollable table of the returned data, with the first row selected by default and shown in orange. Note that the orange point in the active chart corresponds to the selected row.
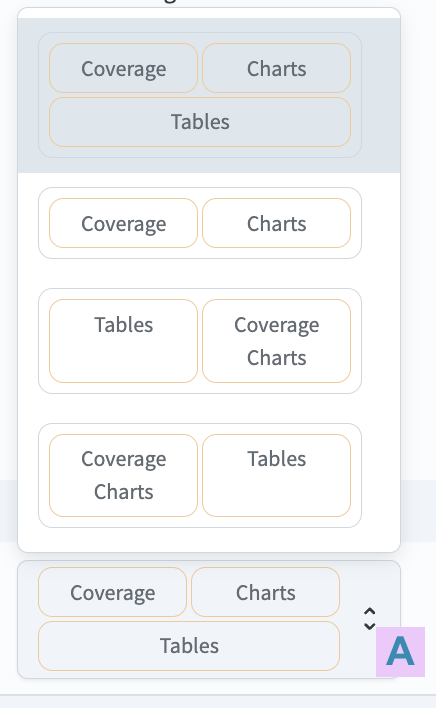
6. View layout options. At upper left, click on the menu icon (three horizontal lines; D in Figure 1) to open the sidebar menu. Under “Results Layout”, click on the icon of the default layout (A in Figure 2) to see all layout options.

Figure 2: The sidebar menu with options for the results view layout.
7. Change the layout. In the sidebar menu in Figure 2, choose the two-panel view of coverage charts on the left and tables on the right. Notice that the active chart (the plot) is still available as a tab at upper left. Reopen the sidebar menu to try other layouts and return to the default three-panel view.
8. Execute another query.
Click on the tab “DP0.2 Catalogs” to return to the ADQL interface.
Change the query to return objects with i_cModelFlux \(>\) 3600 nJy (22.5 mag).
Execute the query.

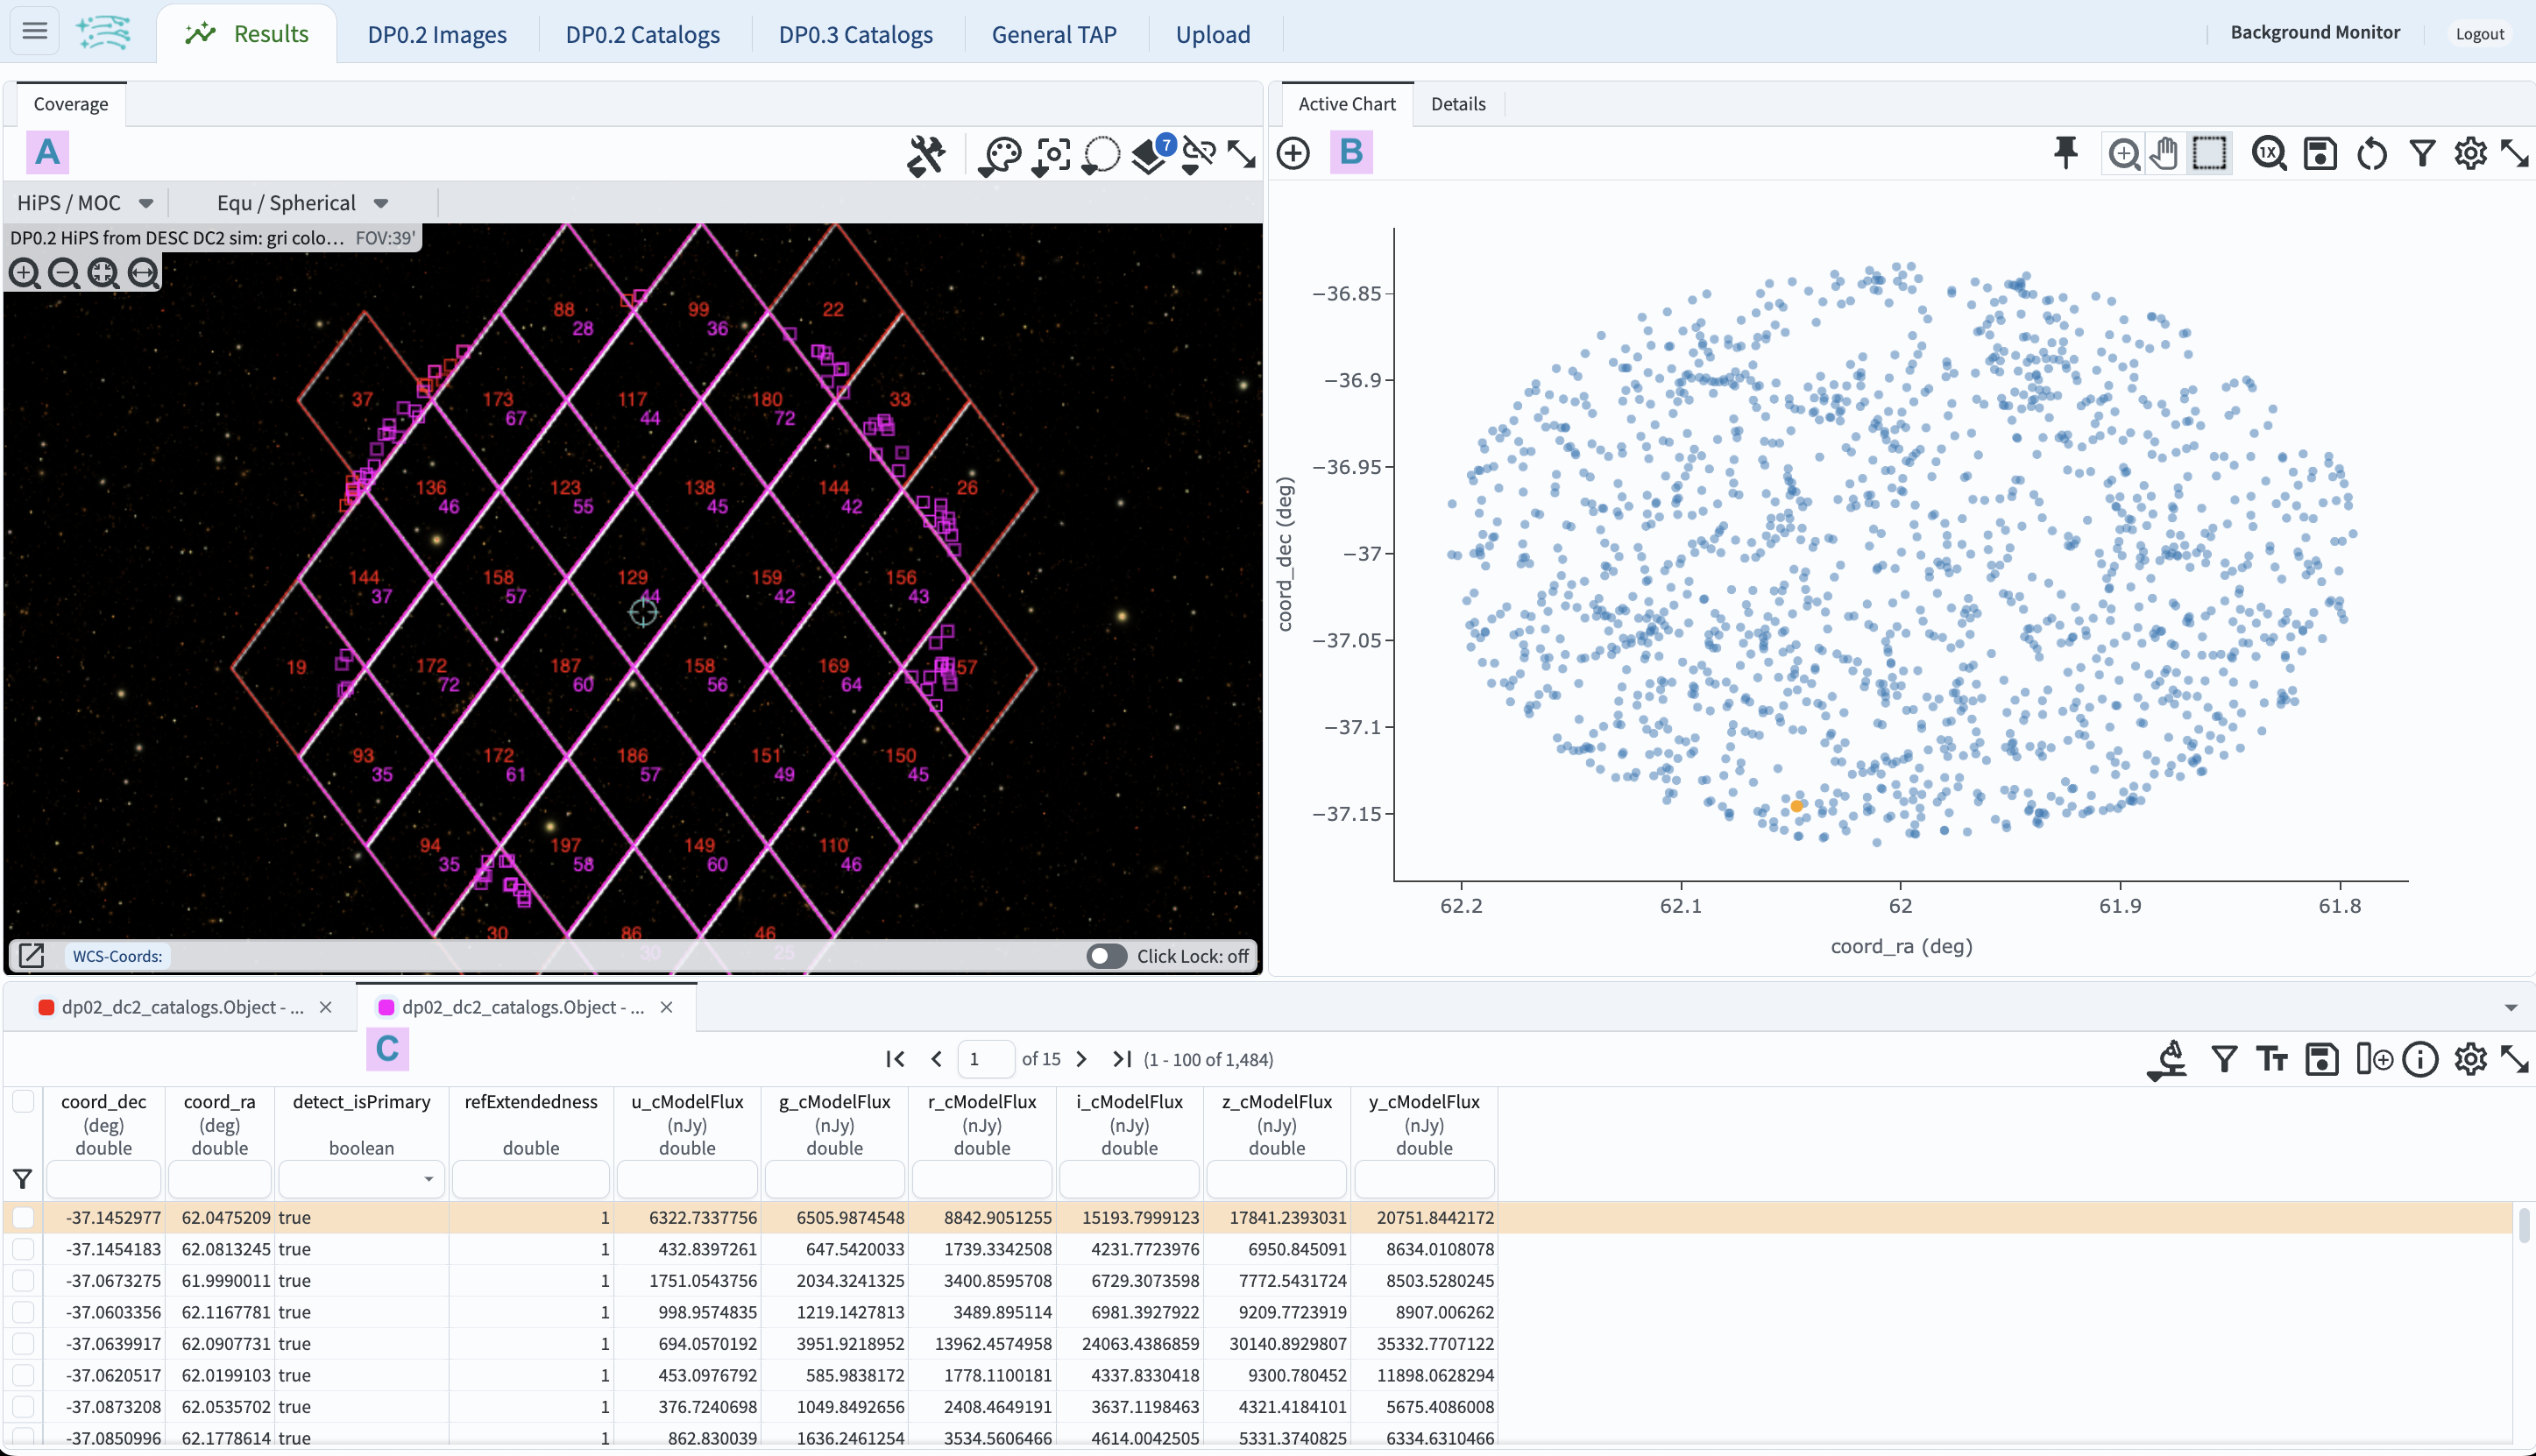
Figure 3: Similar to Figure 2, but with the results of two queries.
9. View multiple query results. The Results tab components are now populated with the data from the new query (Figure 3). The coverage chart includes HEALpix maps for both queries, with the new one in magenta (A in Figure 3). The active chart uses data from the new query results (B in Figure 3). The table now has two tabs, one for each query (C in Figure 3). Click on the tab for the first query and note that the table and active chart change.
10. Delete unwanted query results. In the table (C in Figure 3), click on the X in the tab for the first query results to delete them.
Return to the list of DP0.2 Portal tutorials.