How to execute a sample User Interface (UI) query
This example uses the DP0.2 Catalogs to illustrate steps necessary to execute a UI query in the Portal aspect of the Rubin Science Platform (RSP).
The default landing page in the Portal aspect of the RSP reveals several tabs allowing a choice of various image or catalog repositories. The example given here uses the “DP0.2 Catalogs” repository, and this is the one to be selected here. There, two types of queries are available: “UI Assisted” (amounting to single-table queries - default), or “ADQL Queries.” It is possible to toggle between the two by clicking on the botton to the right of “View:”. Each of these options has a different user interface. This “How to” covers the UI version.
Table selection: Within the “DP0.2 Catalogs” tab, it is possible to choose the table to work with by clicking the “up-down” arrow to show the available tables. The default table in the right drop-down menu is the “dp02_dc2_Object” table, which will be used this for this example. Once any of the tables in the DP0.2 Catalogs repository is selected, the table view at lower-right will automatically update to match the selected table.
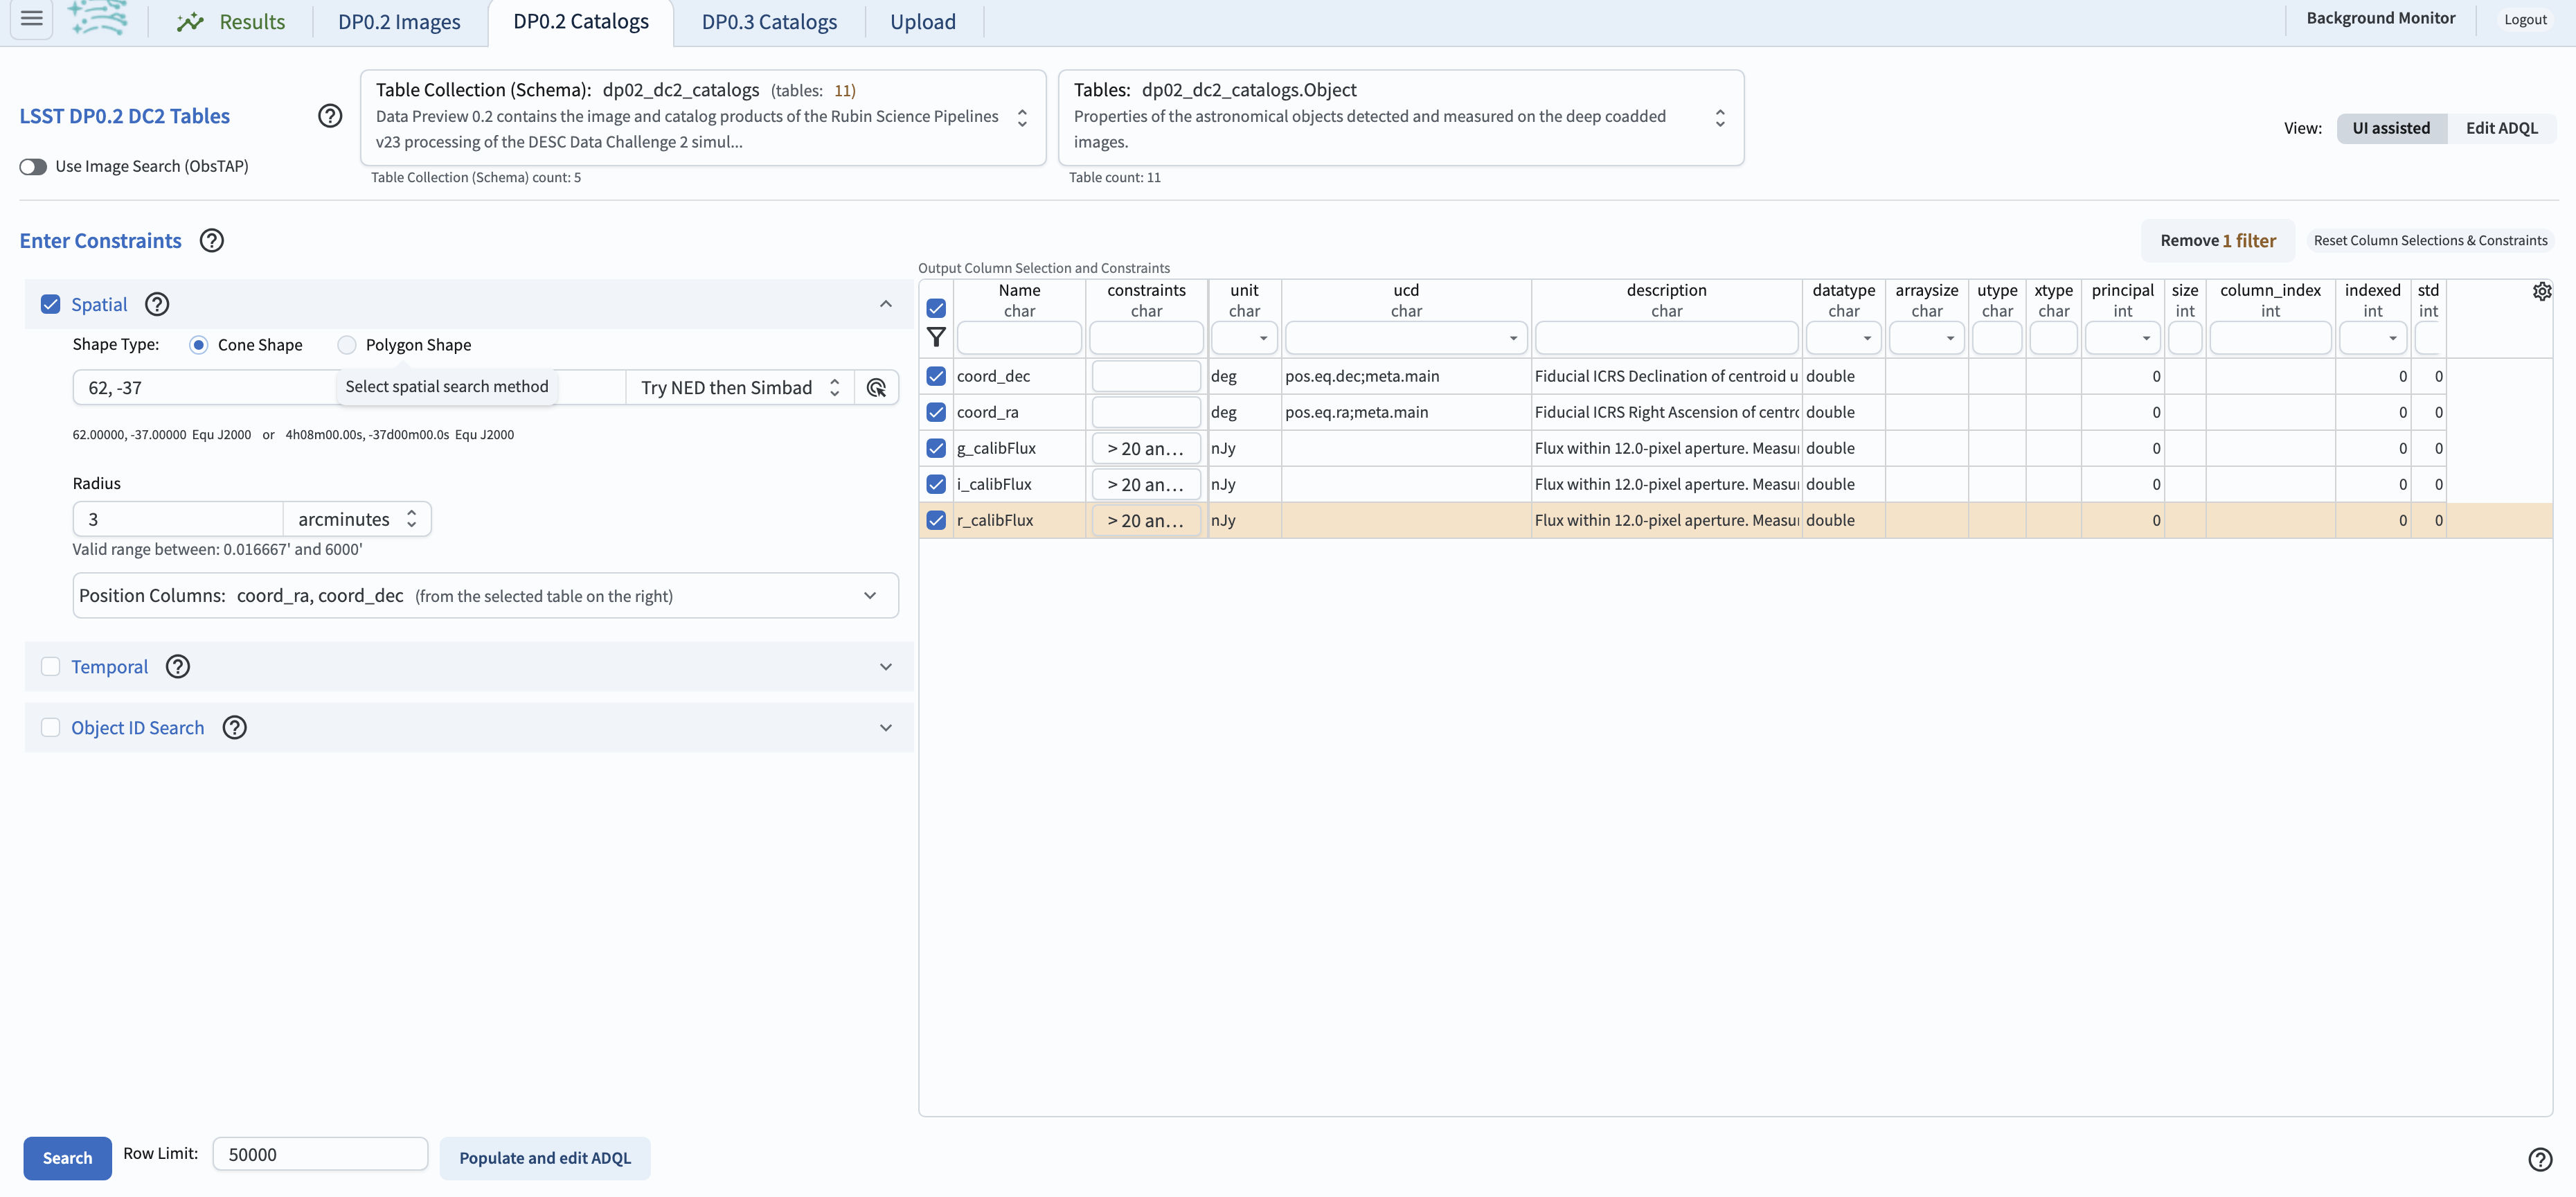
Entering the constraints: This example will use the spatial constraints, selected by checking the box by “Spatial.” For “Spatial” constraints, two shapes type for a spatial search are available (“Cone” or “Polygon”), and the appropriate instructions for the search terms will appear. This example uses the cone search, which requires “Coordinates or Object Name” and “Radius” of search to be entered in the box under the “Shape Type” on the left side of the screen.
Keeping the search area small will keep query times short and return manageable subsets of objects.
It is recommended to start with 3 arcminutes.
Note that the central (RA, Dec) coordinates for DC2, in decimal degrees, are: 61.863 -35.790.
The longitude and latitude columns in “Position Columns” do automatically update to be the correct column names for right ascension and declination for the selected table. If a non-existent column name is entered, the box will highlight red in indication of the error.
The table view: The table to the right of “Enter Constraints” enables users to apply additional search constraints on the columns in the selected catalog table. Some tables have a lot of data columns. It is possible to search for desired data columns by entering terms (e.g., ra, Flux, or flag) in the boxes underneath “Name” and pressing “enter” in order to view data columns of interest. Entering, e.g. “ra” will return all rows containing “ra” in the name (those will be highlighted).
The selection of the data column names to be returned by the query is via using checkboxes in the left-most column in the table. Viewing only the selected data column names can be done by clicking the funnel icon to filter the columns of interest. For the retrieval of only the data which meet specific constraints is desired, one can use the “constraints” column to specify query parameters. For example, entering “> 300” in the “Constraints” box in the “g_ap03Flux” will restrict the entries at > 300 nJy.
The removal of filters and resetting of the table view at any time is by using the “Reset Column Selections & Constraints” button above the upper-right corner of the table.
Row limit: The “Row Limit” in the bottom of the page can be changed to apply an upper bound to the number of rows returned. The Portal can work effectively with datasets with millions of rows. However, when learning or testing queries, it is advisable to limit the number of rows (e.g., 10000 rows is useful for testing).
Note: Because of the implementation of the Rubin Observatory “QServ” database, it is not recommended to use the row limit alone in order to get a “sampling” of data. Queries with only a row limit can run for much longer than one might intuitively expect; applying a spatial constraint is likely to return a result more quickly.
Example UI assisted query: The image below presents an example of how to search the DP0.2 Object catalog using a 3 arcminute cone near the DC2’s central coordinates, returning only the five data columns “coord_ra”, “coord_dec”, and “g” “r” and “i_calibFlux”, and imposing the contraints that the flux must be between 20 and 1000 nanojansky (i.e., between 24th and 28th magnitude).

An example query of the DC2 Object catalog.
Search: Pressing the search button at lower left will start the execution of the query. The search might take a few moments.

This will show while the search is executing.
Cancel: It is possible to cancel a query while it is executing by clicking the “Cancel” button.
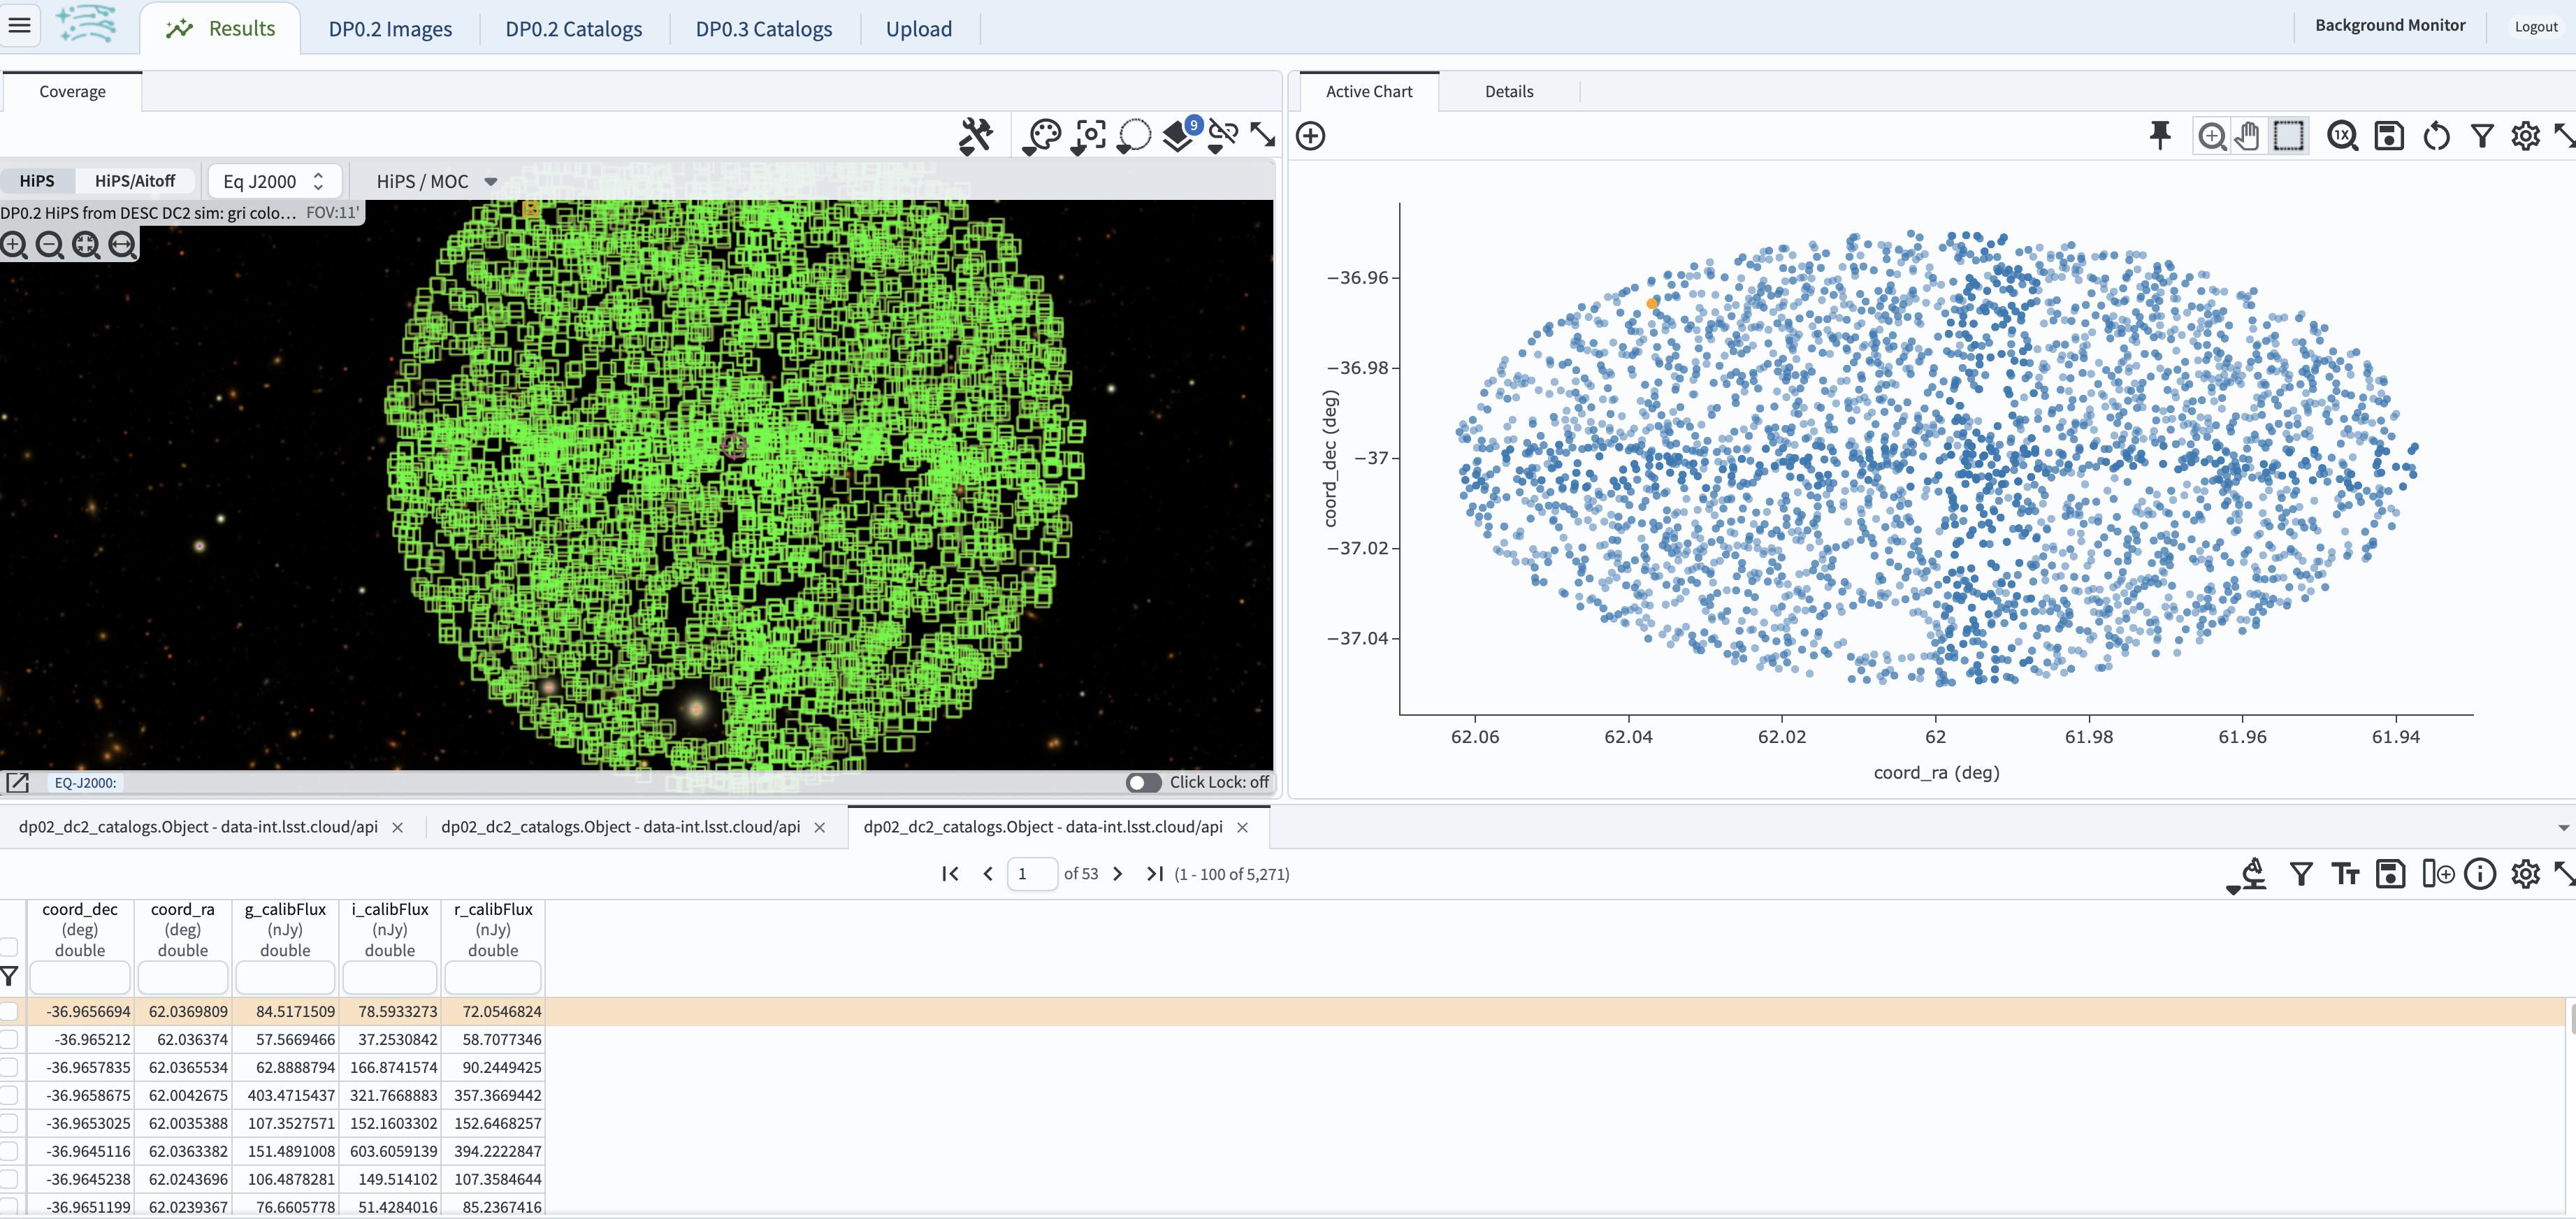
Results view: The search results will populate the “Results” view, as shown in the figure below. The display layout is controlled by the “hamburger” button (three horizontal lines) at upper left. It is possible to change the layout by clicking on this icon and then on the “Results Layout” tab. The screenshot below uses the “Coverage Charts Tables” choice with a sky image at upper left. The color-composite image shows the relevant DC2 simulated sky region. A default “active chart” of the sky coordinates appears at upper right, and the table of results along the bottom. Note that by default, the “active chart” displays the two leftmost columns in the table against each other.

The default view of the search results.