06. Exploring SAOImageDS9-like Functionality in the Firefly-based RSP Portal
RSP Aspect: Portal
Contact authors: Yumi Choi
Last verified to run: 2024-10-22
Targeted learning level: Beginner
Introduction: This tutorial will explore some of the key functionalities available in the Firefly-based Rubin Science Platform (RSP) Portal that are also familiar to users of SAOImageDS9 (hearafter DS9), a widely-used astronomical image viewer. Both DS9 and Firefly allow astronomers to display, analyze, and interact with FITS (Flexible Image Transport System) image data, offering features like multiple frame support, region of interest (ROI) tools, color mapping, and overlay capabilities. While Firefly and DS9 share many powerful tools, they each bring unique strengths to image analysis.
This tutorial will demonstrate Firefly’s key functionalities in the RSP Portal, enabling users to effectively utilize these tools for their astronomical research.
Step 1. Query for Images
The first step is to query images to explore with Firefly functionalities.
1.1. Log into the Portal Aspect, click “DP02 Images” tab at the top.
1.2. Under Observation Type and Source”, choose “Calibration Level” 3, which is for derived images such as deepCoadds and difference images. Leave the other options to their default settings except for the “Data Product Subtype” select “lsst.deepCoadd_calexp”.
1.3. Under “Location”, choose “Observation boundary contains point” from the drop-down menu and enter the coordinates “56, -34.9” - this is a random location within the DC2 footprint. Do not set any timing, spectral coverage, or object ID search constraints.
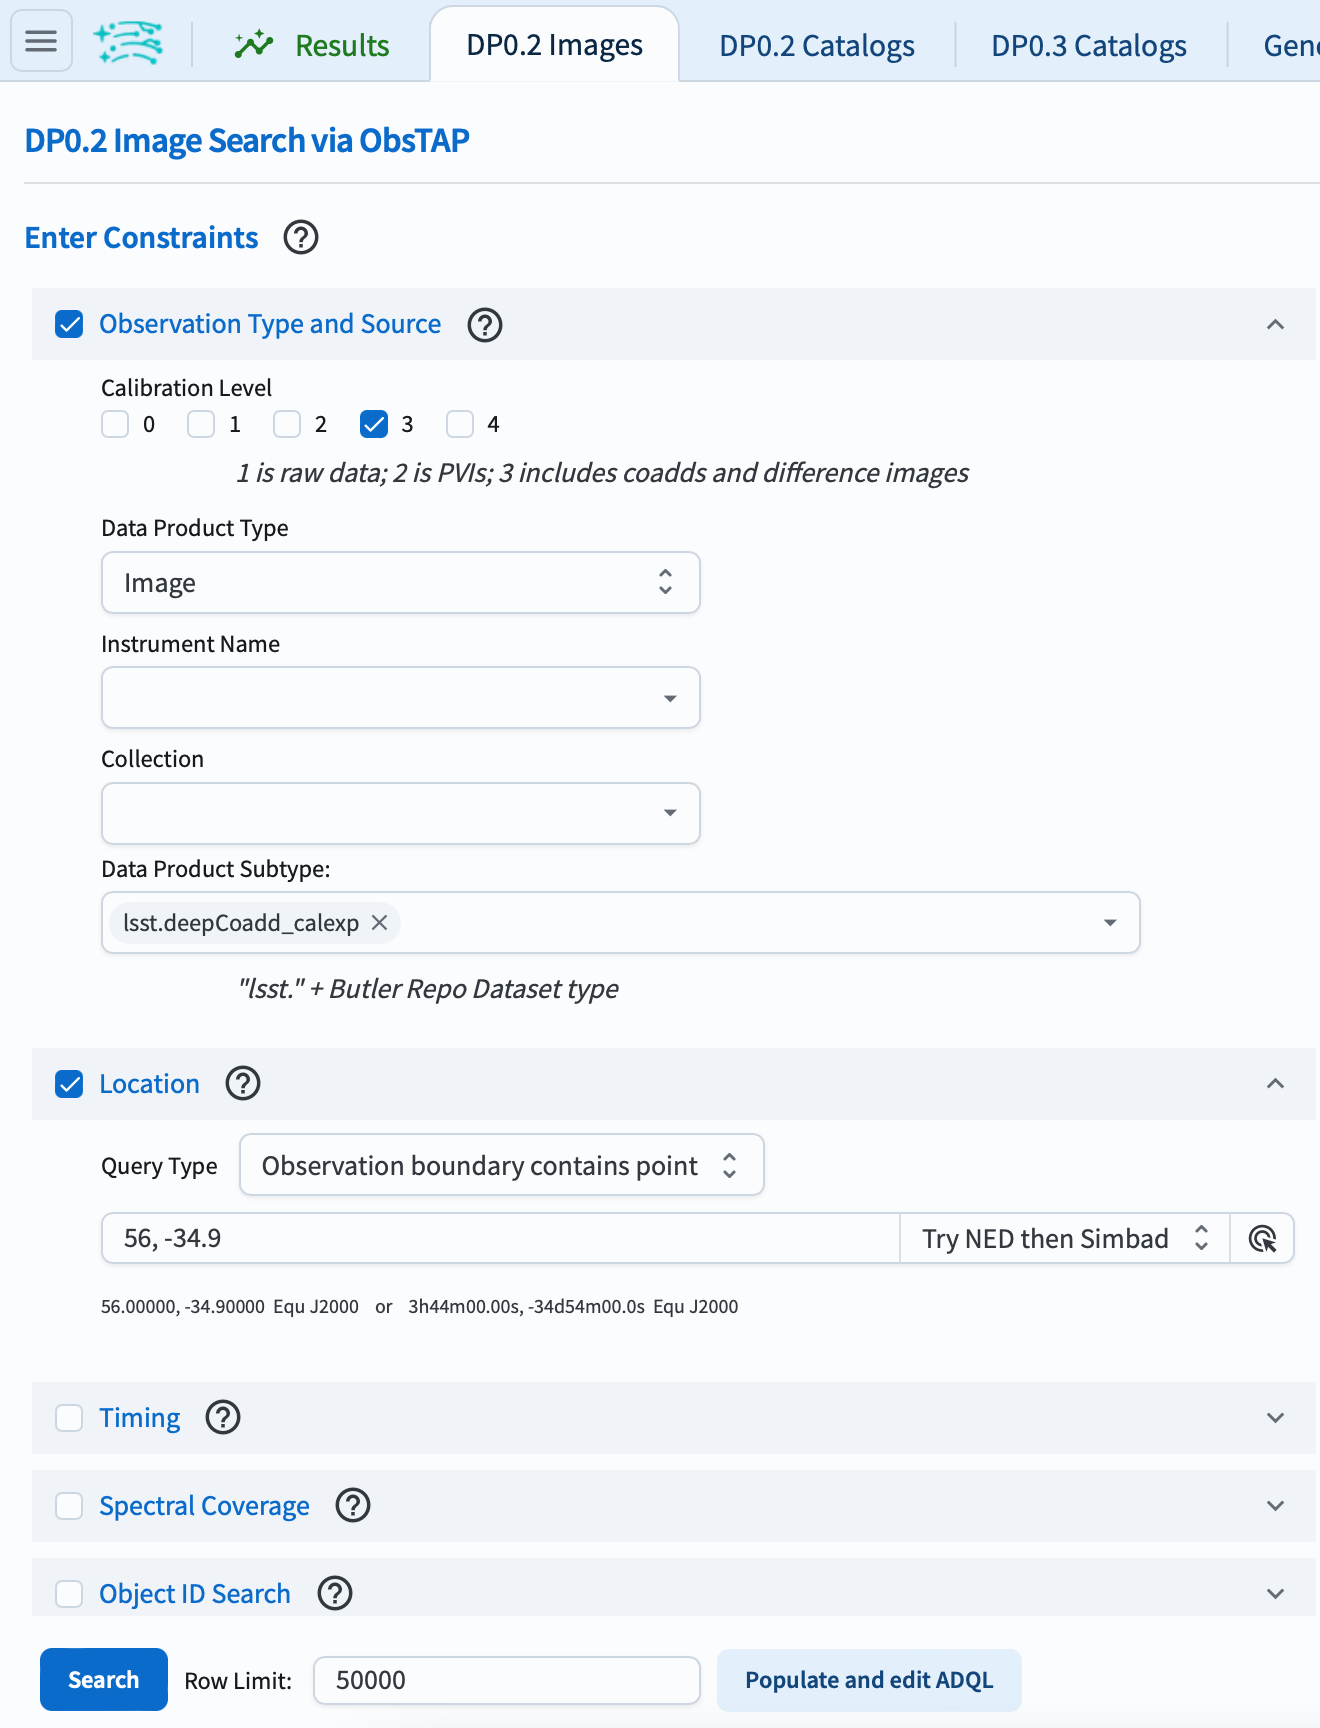
Figure 1: RSP Portal aspect with “DP0.2 Images” selected, prepared to query images.
1.4. Click “Search”, and the Portal will execute the query and display the default results view. (Click on the “Data Product: ivoa.ObsCore…” tab, if necessary.)
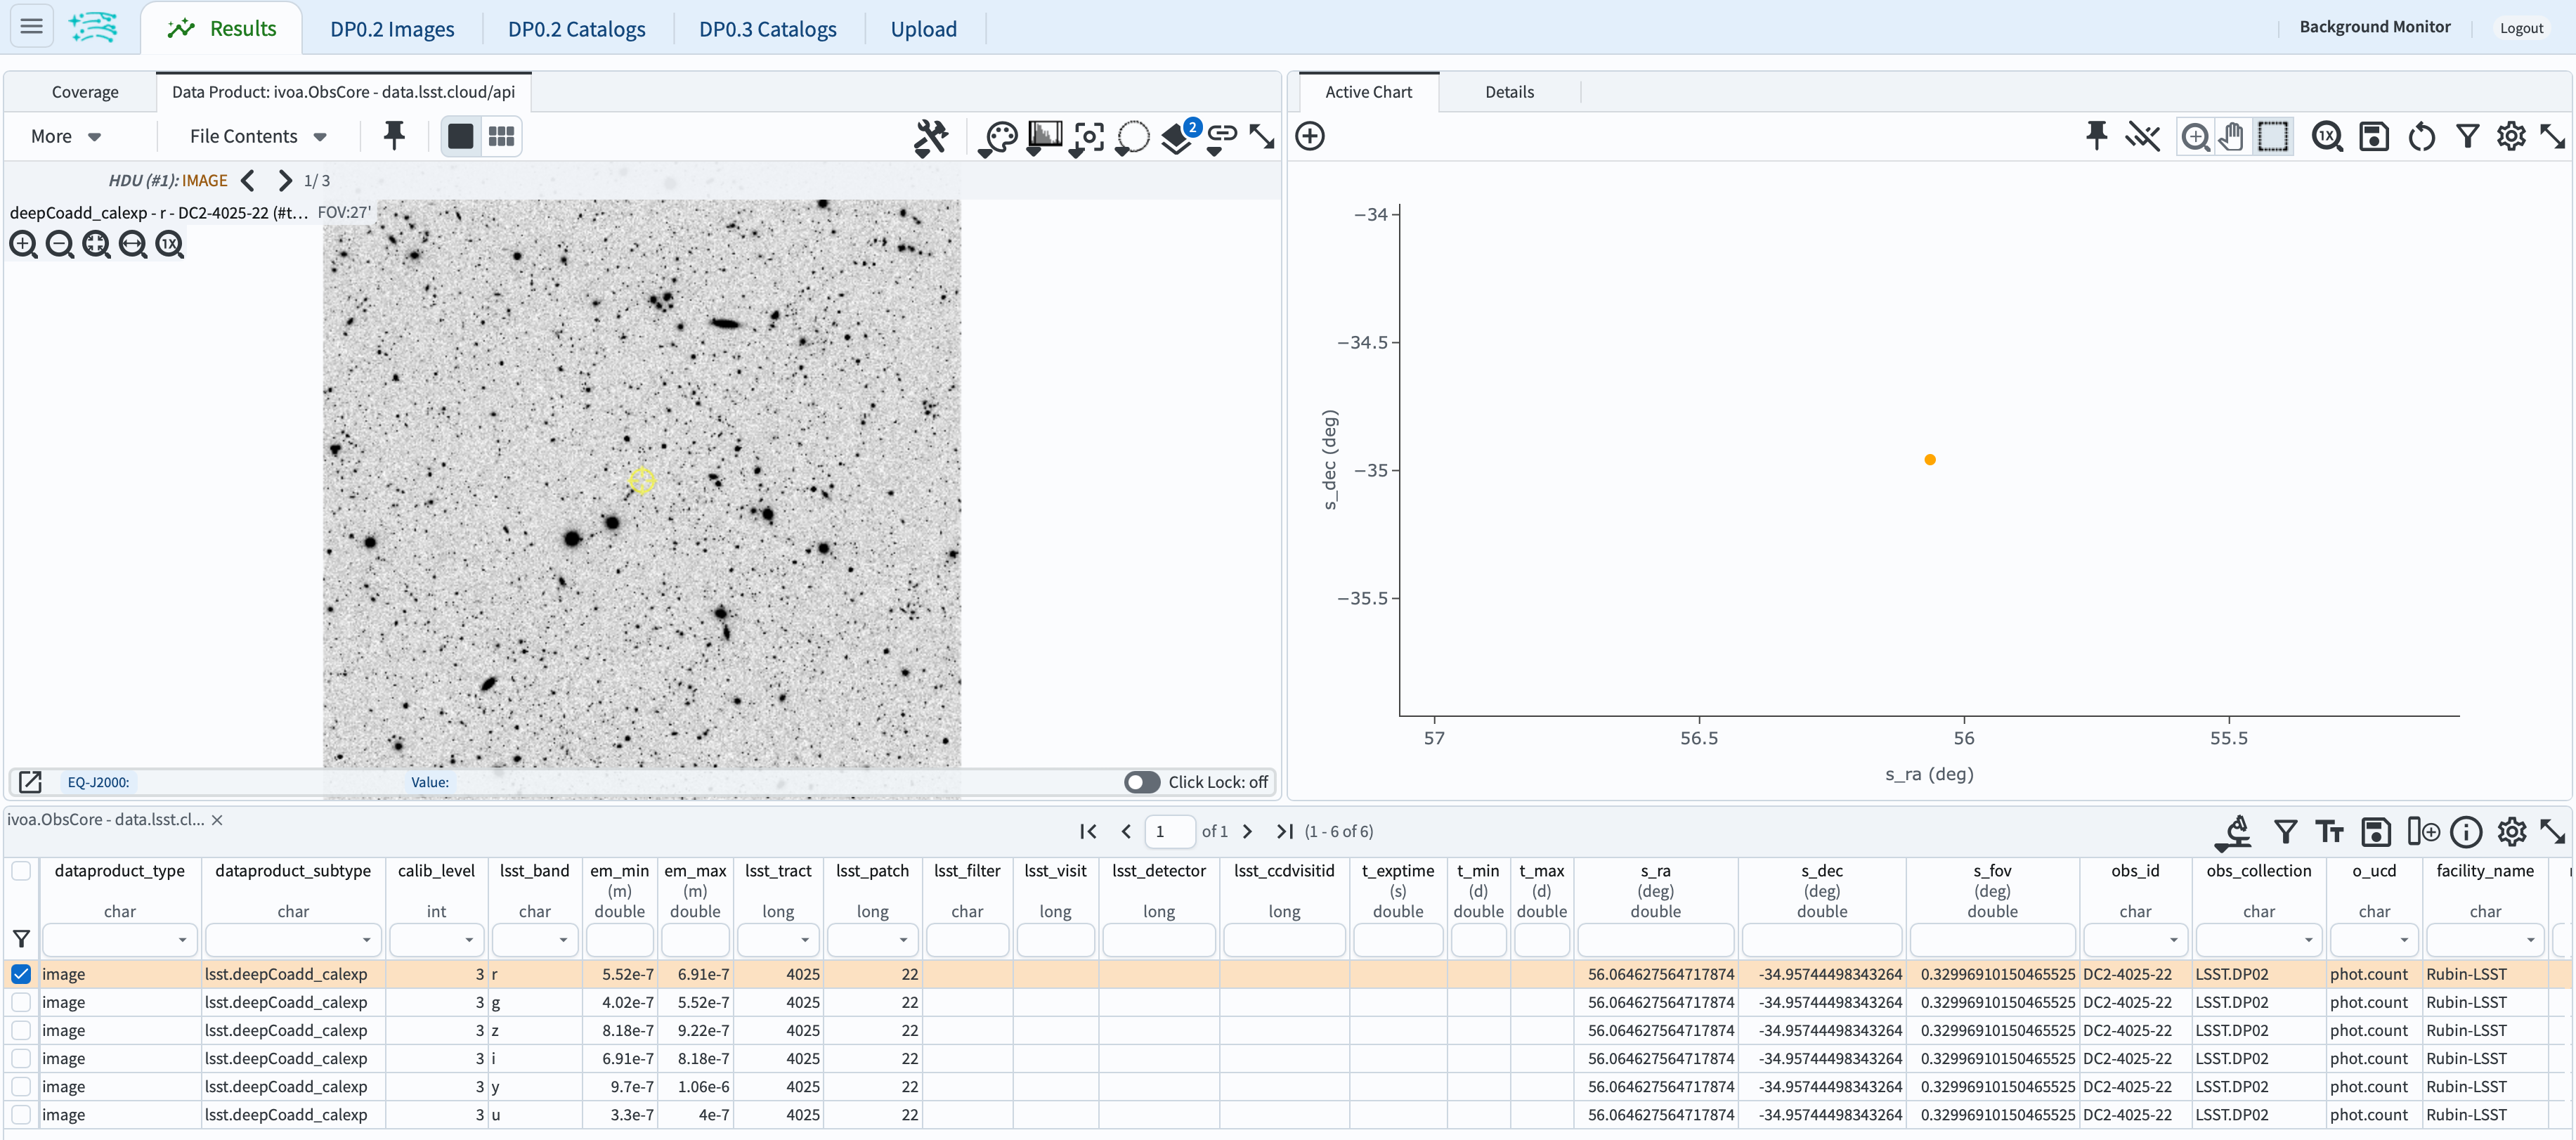
Figure 2: The default results view for the DP0.2 Image Query.
Step 2. Add Layers to the Active Image(s)
Additional information can be overlaid on the active image(s) as layers.
2.1. Overlay a compass, coordinate grid, and ruler on the images. First, click the “Tools” icon to open the drop-down menu. Under the “Layers” section, click the “North-East arrow” icon to add the compass, click “Grid” icon to add a coordinate grid, and click “Ruler” icon to measure the distance between two user-identified points. To measure distance, click on the starting point, then drag to the endpoint. This will display an arrow on the image along with the angular separation between the two points and the position angle.
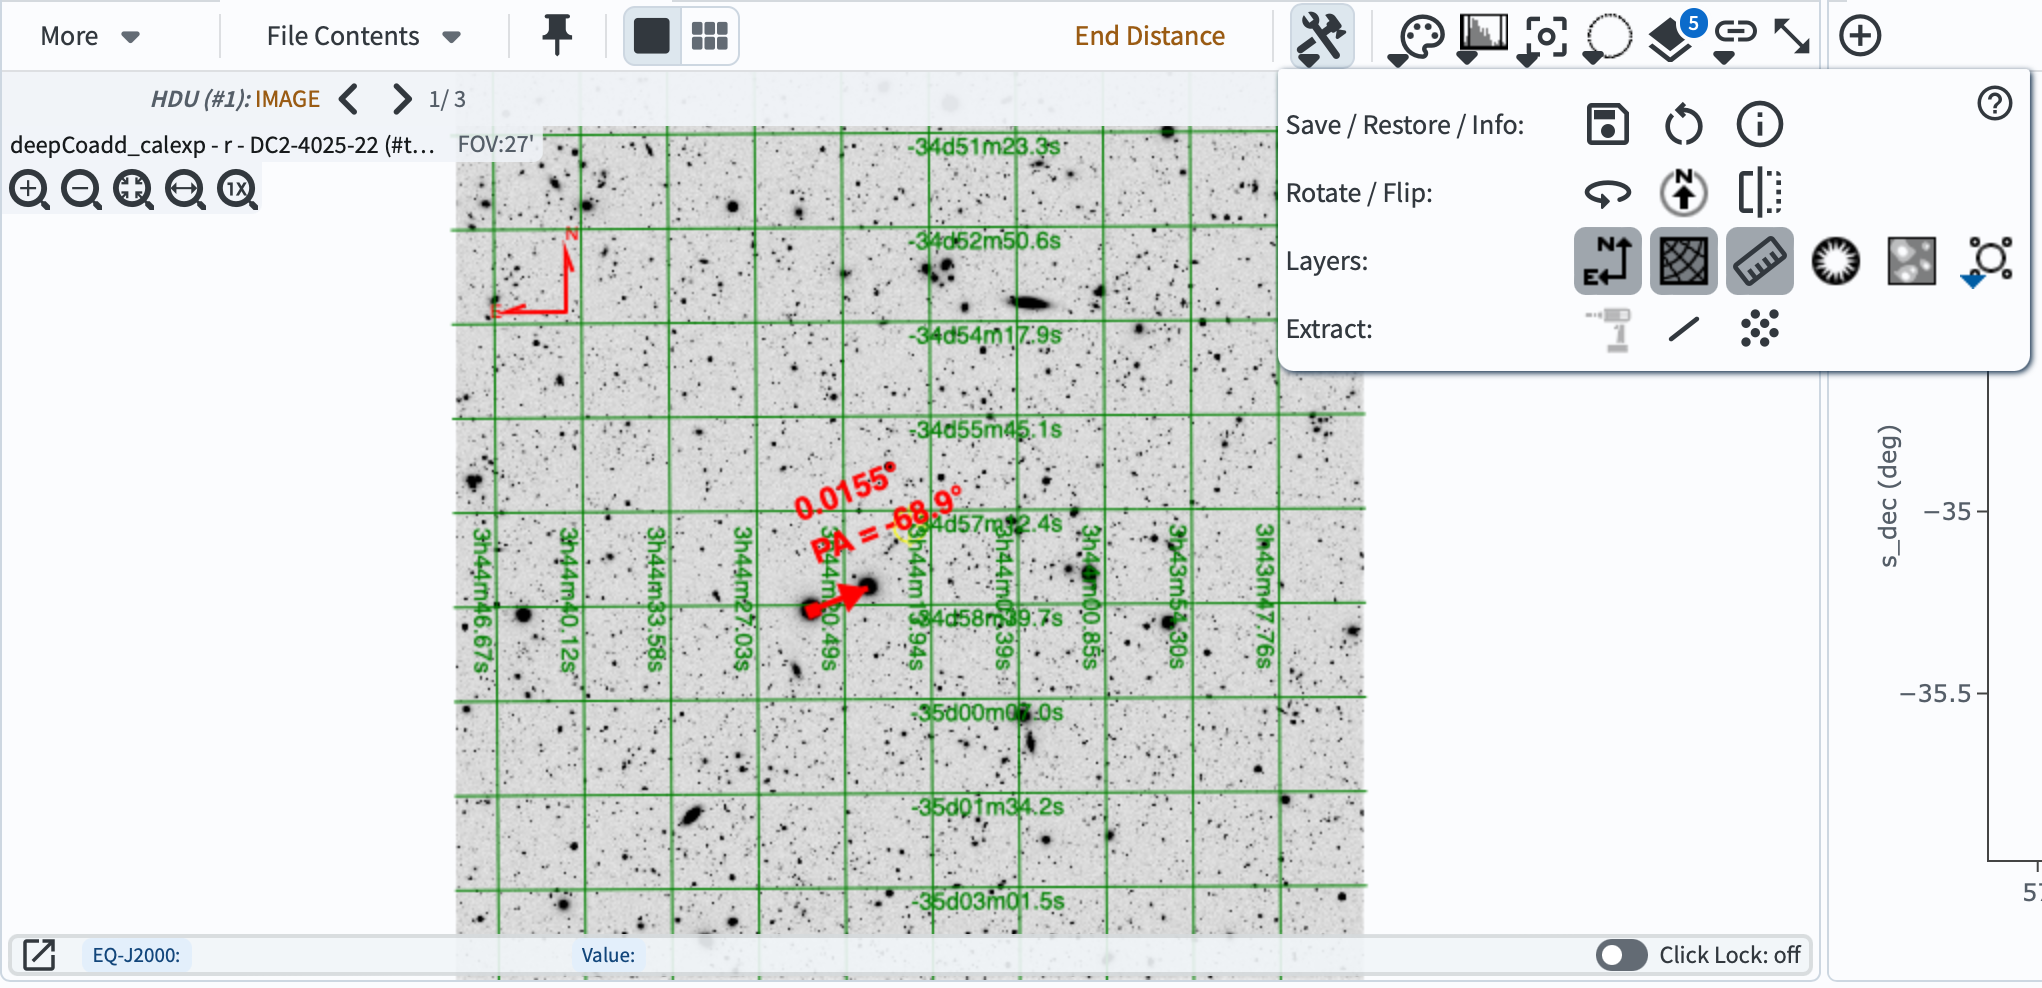
Figure 3: The image overlaid with a compass, coordinate grid, and ruler.
Warning: Switching between single and tile frames does not retain the applied layers, except for the compass indicating the North and East directions on the image.
2.1.1. Select the Coordinate Systems to Overlay and to Read Out. To select a coordinate system to overlay on the image, open the drop-down menu under the “Grid” option from the “Manipulate overlay display” icon (magenta circle). For the Equatorial coordinate systems, two formats are available for displaying astronomical coordinates: sexagesimal and decimal. The readout coordinate format is independent of the coordinate format for the overlaid grid. To choose a readout format, click the colored box (blue square) next to the “expand window” icon at the bottom left corner of the image panel. Having different coordinate systems for the overlaid grid and readout is useful for determining an object’s position across the two reference frames.
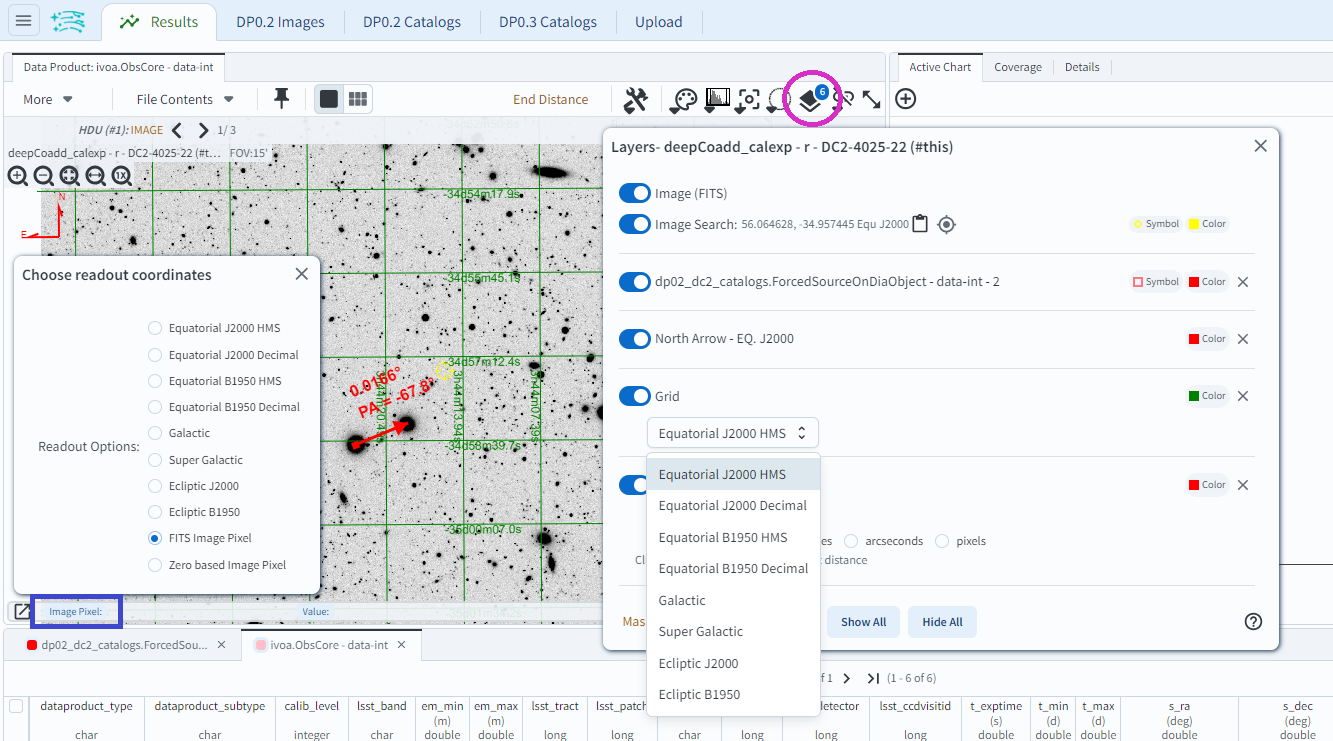
Figure 4: Demonstration of selecting a coordinate system for the overlaid grid and configuring the readout format.
Note: Remove a layer completely by clicking the “x” next to the “color” box, or temporarily disable it by toggling the sliding button for that layer.
2.1.2. Manipulate the Distance Tool. A different unit other than the default degrees is available for measuring the distance between two selected points. Options include arcminutes, arcseconds, and pixels. To change the unit, go to the “Distance Tool” option under the “Manipulate Overlay Display” icon, and choose the unit to use. Check the “Offset Calculation” box to display the separations along the x and y axes on the image.
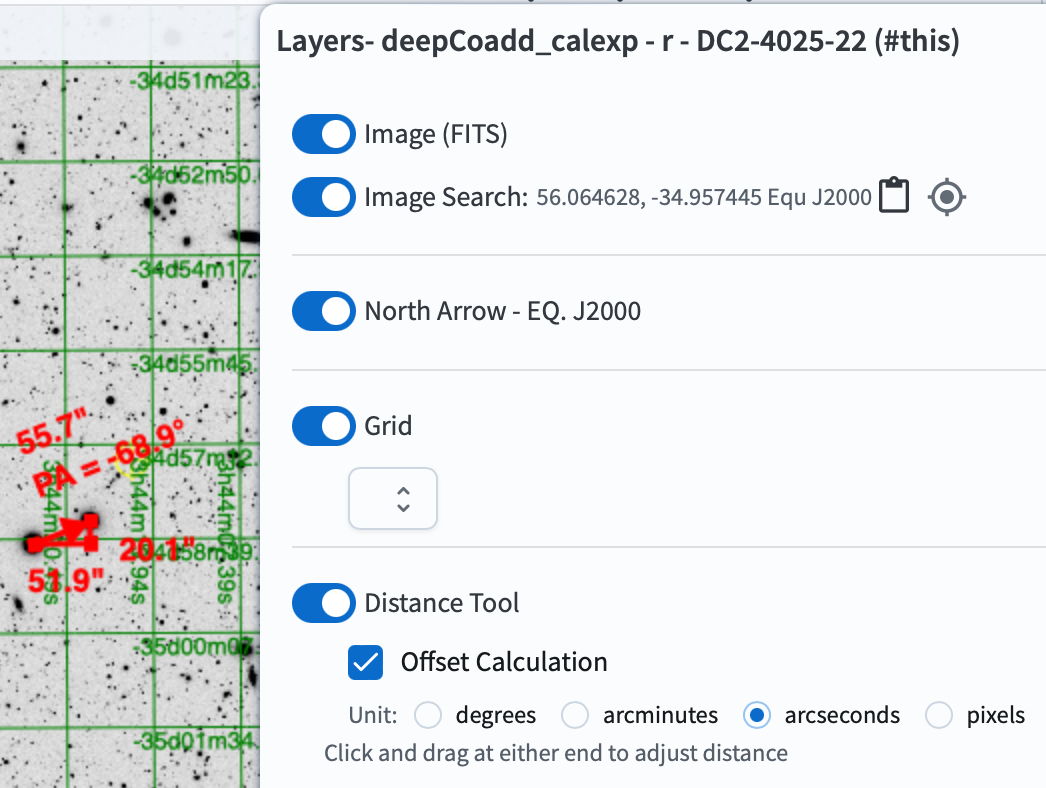
Figure 5: Demonstration of the distance tool in use, displaying the angular separation between two selected points.
2.2. Upload a DS9 Region File. A DS9 region file can be uploaded to the Portal, and overlaid on the image. Download an example region file to your computer using the link to the file. If new to GitHub, click this link to navigate to the GitHub repository containing the example region file, then click the “Download” tab (an icon of an arrow pointing into a box). To load the region file into the Portal and overlay the entries on the image, click the “Tools” icon to open the drop-down menu. Under the “Layers” section, select the “Load a DS9 Region File” icon to open a file upload window. Click “Choose File”, select the region file from your computer, click “Upload”, and then click “Draw”. It should overlay six circles on the image.
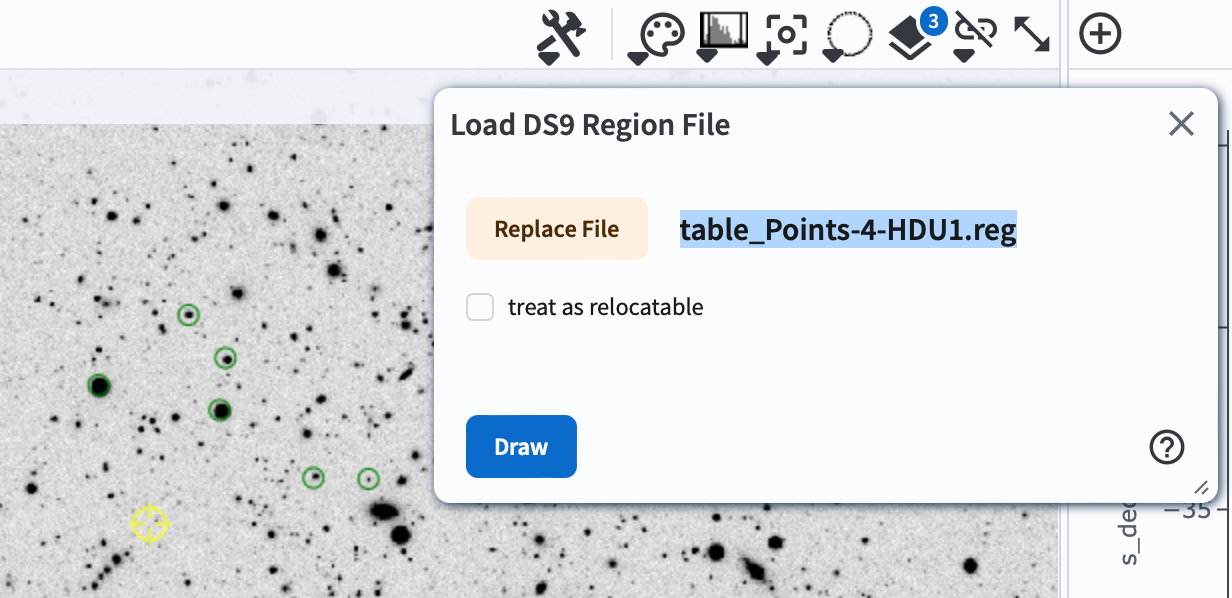
Figure 6: Six entries from the uploaded region file are overlaid on the image.
2.3. Mark up the Image. Markers can be added to the images. Click the “Tools” icon to open the drop-down menu. Under the “Layers” section, click the last icon and select “Add Marker”. A marker labeled “Marker #1” will appear at the center of the image. Click and drag the marker to the desired location, and adjust its size by dragging any corner of the surrounding box. To edit the marker, click the “Manipulate overlay display” icon and go to the “Marker #1” section. Change the label by typing “galaxy of interest” into the “Label” field, and use the “Corner” drop-down to adjust the label’s position. To change the marker’s color, click the “color” box to open the “Color Picker” window and select your preferred color. To add another marker, click the “Add Marker” box, which will place a new marker at the center of the image.
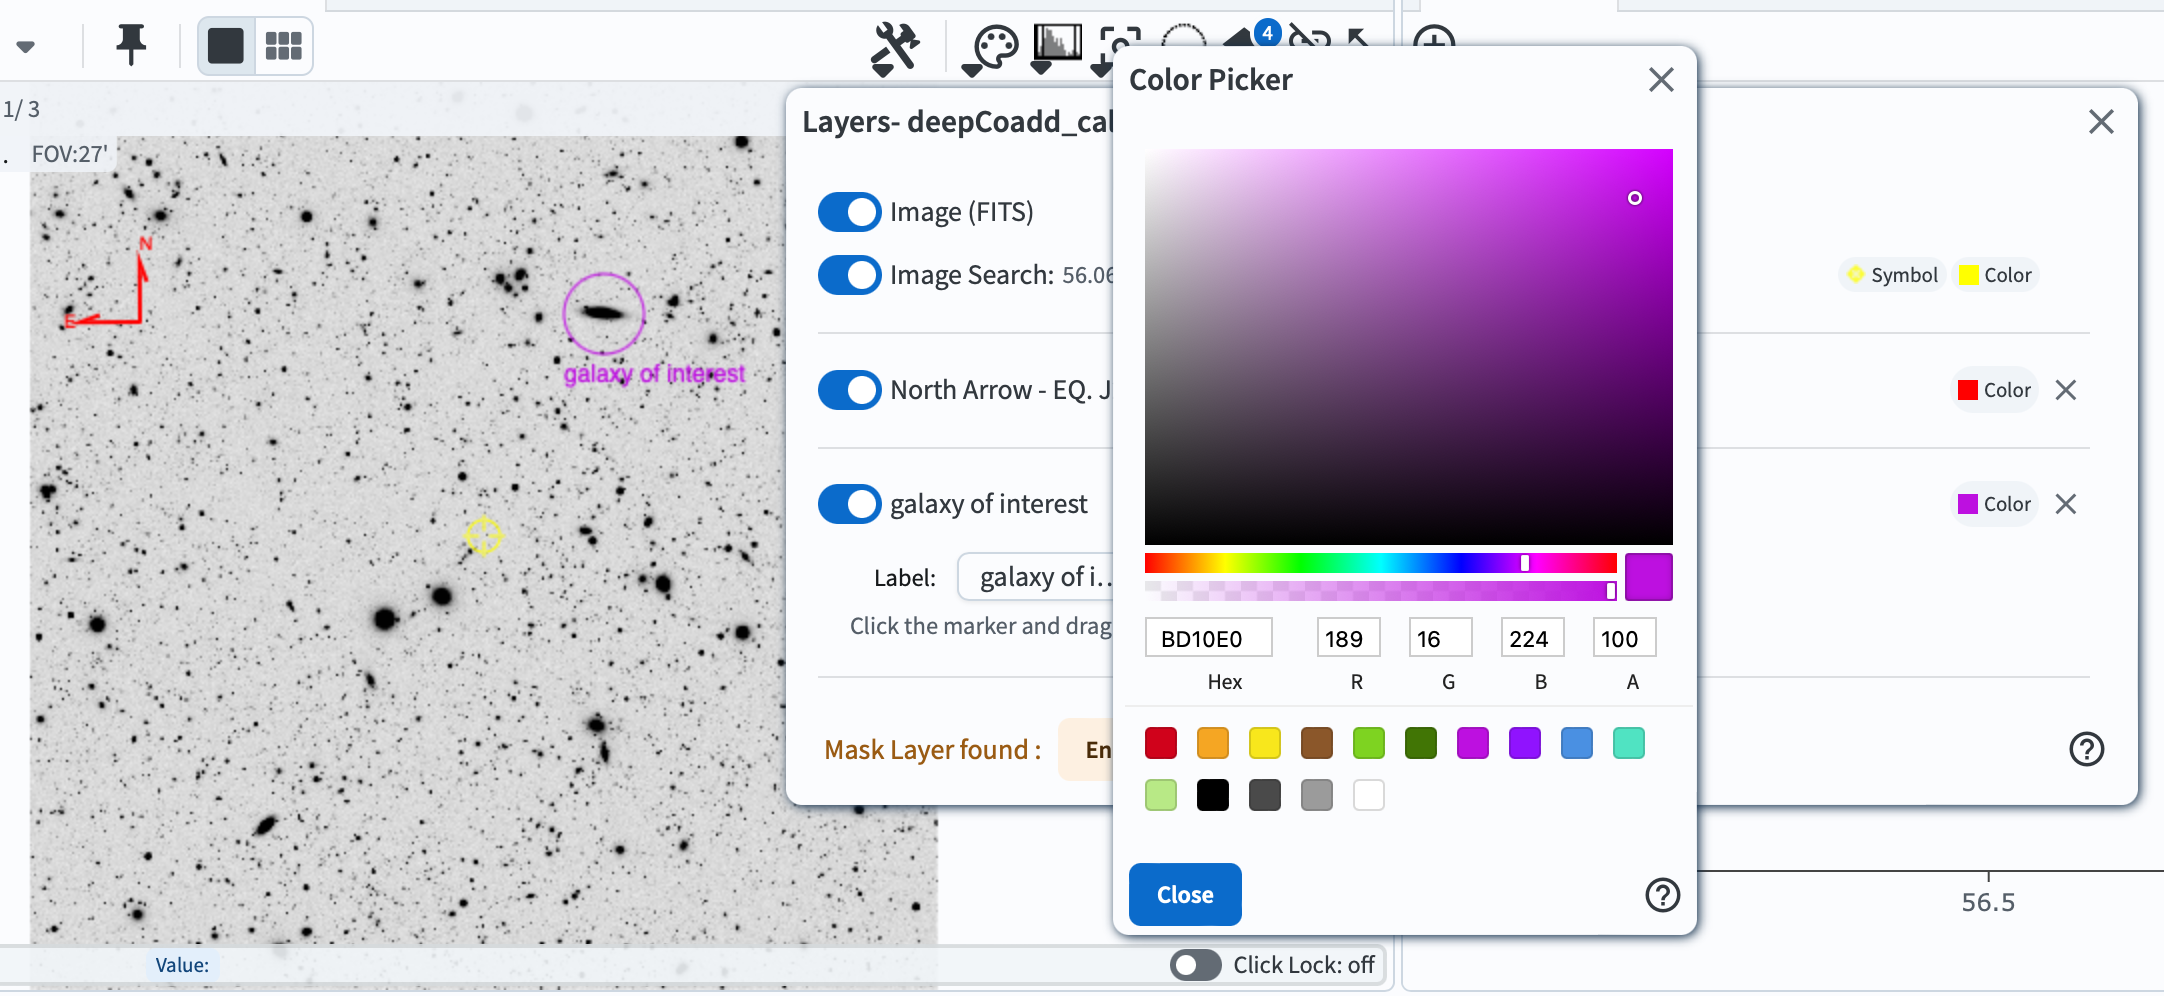
Figure 7: The image with an added marker with the modified label and color.
2.4. Overlay Footprints from Various Observatories and Instruments. Lastly, it is possible to overlay footprints from various observatories and intruments directly onto the image. Under the “Tools” icon, click the last icon under the “Layers” section. Select “IRAC36” from the “Add Spitzer footprint” option, “WFC3/UVIS” from the “Add HST footprint” option, and “NIRCam” from the “Add JWST prelim. footprint” option. All three footprints will appear on the image. Adjust their positions, angles, labels, label locations, and colors as desired in the “Manipulate Overlay Display” section as described in Step 2.3.
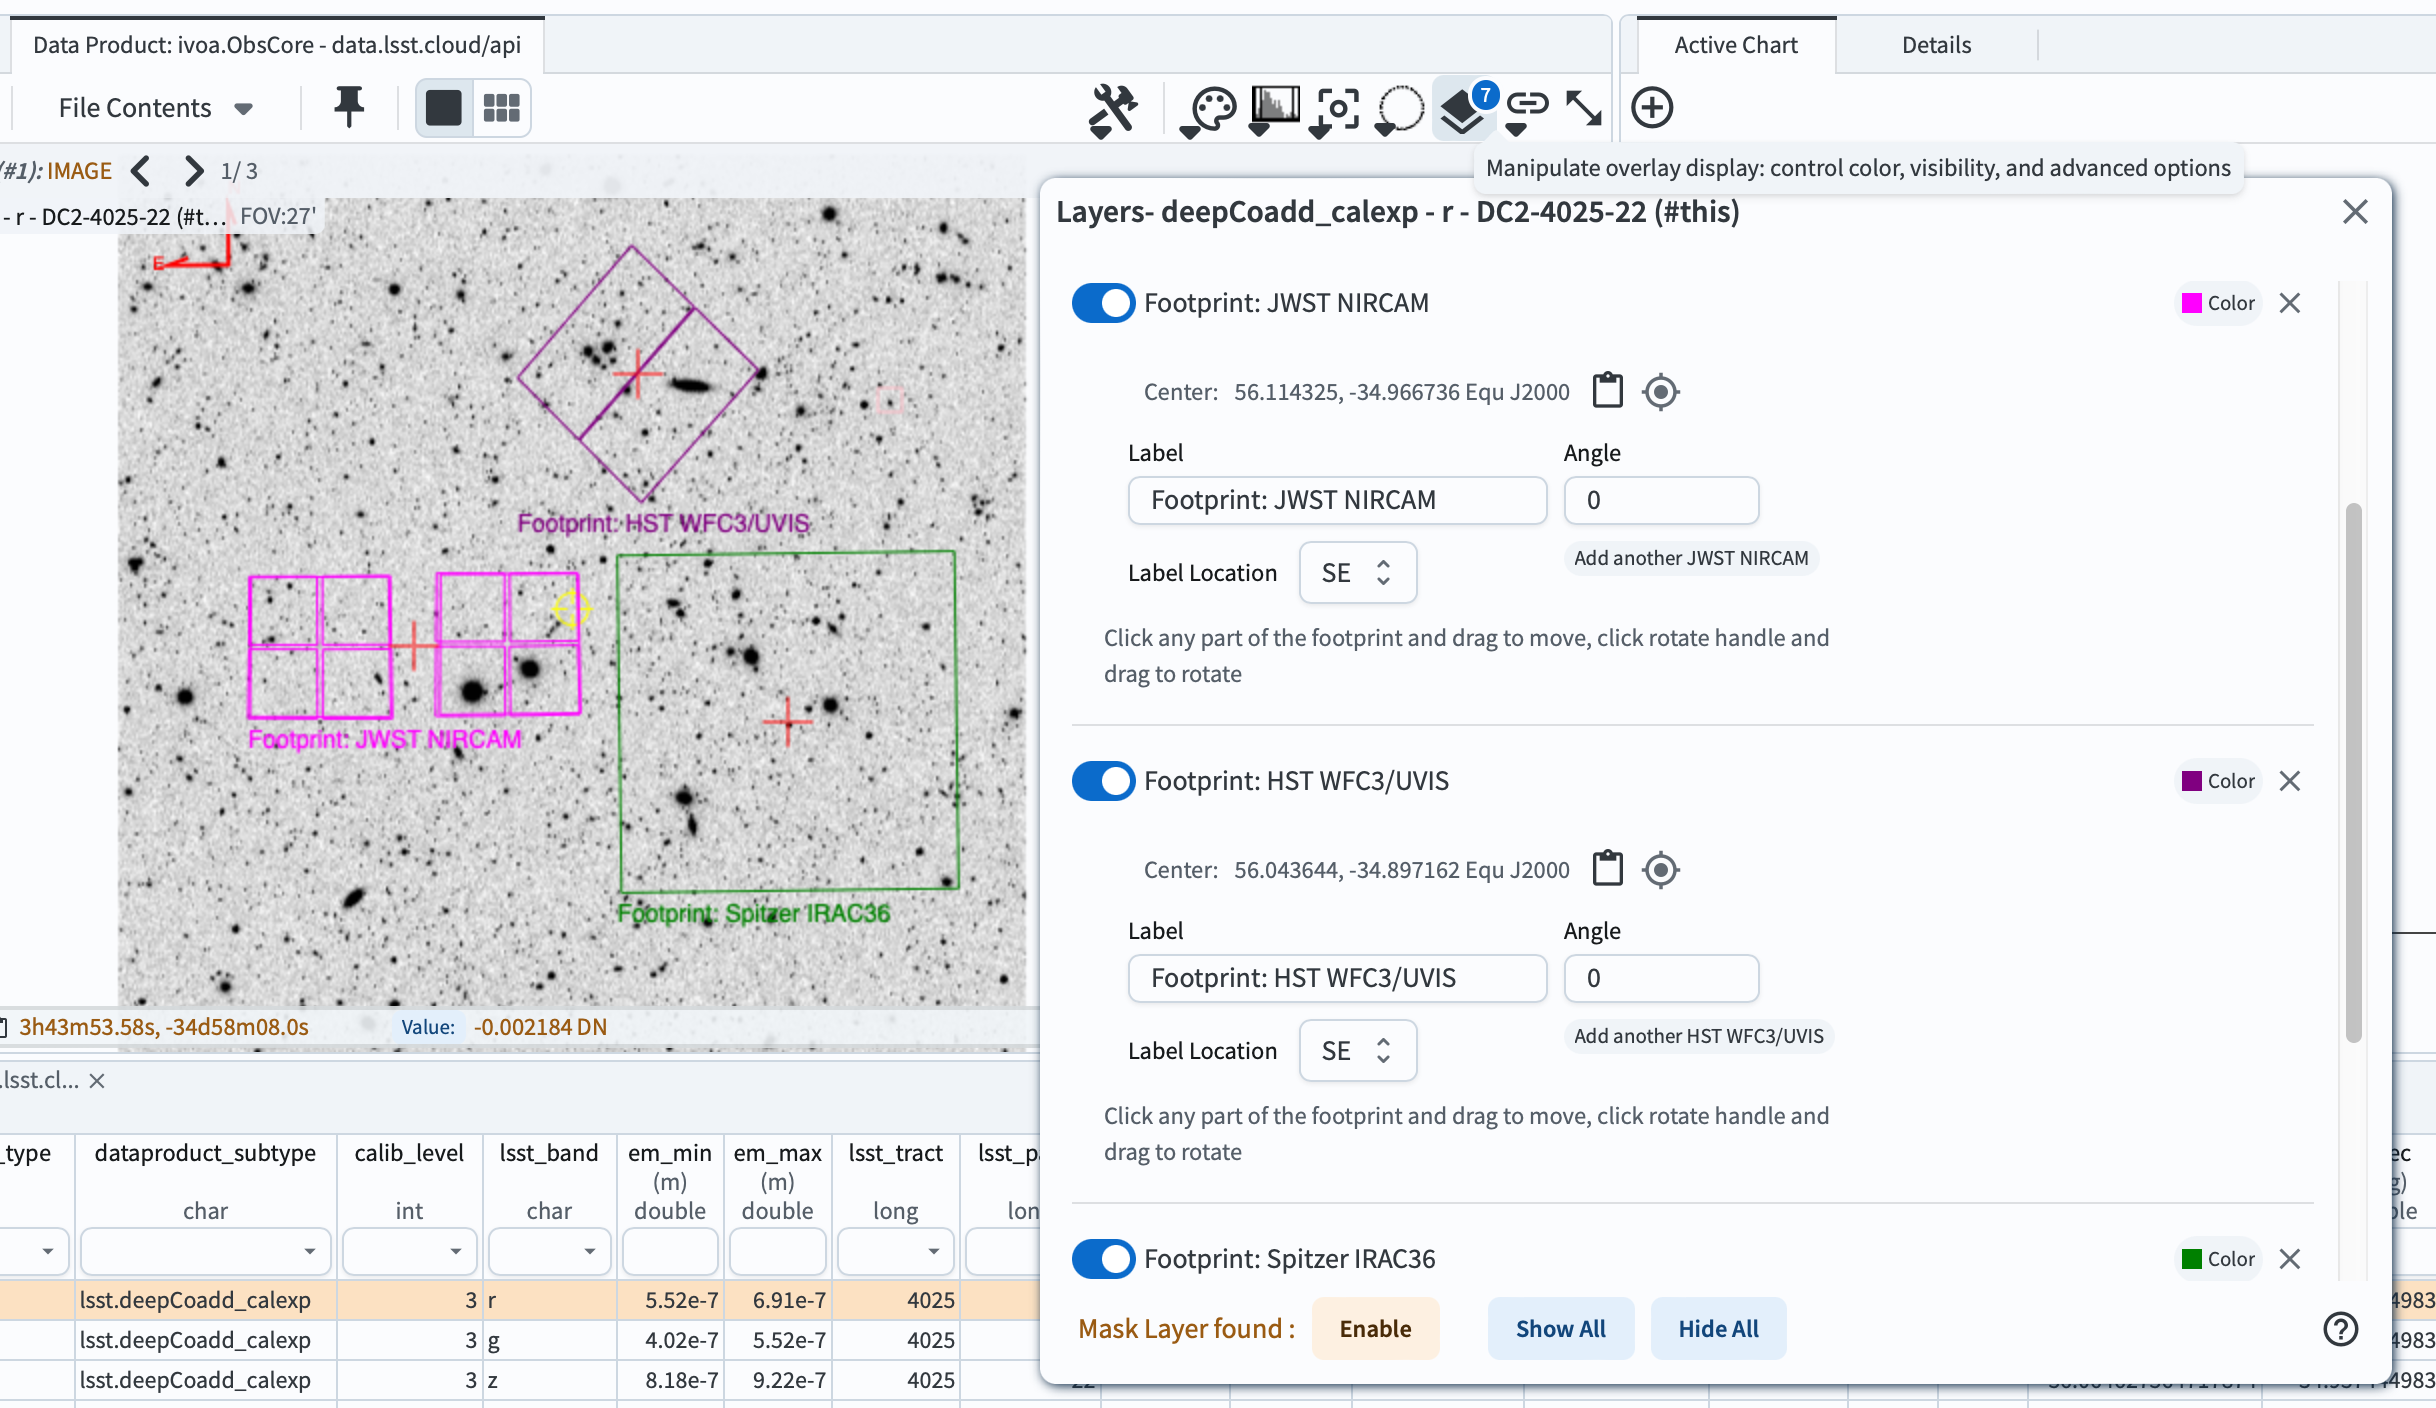
Figure 8: The footprints of the Spitzer/IRAC36, HST’s WFC3/UVIS, and JWST/NIRCam are overlaid on the image.
2.5. Save, Restore, and View Image Information. At any point, if you want to capture all the layers as an image, click the “Tools” icon, then select the “Save” icon and choose “PNG” as the file type. Note that the “FITS” format only saves the default image. To remove all edits and revert to the default settings, click the “Restore” icon. Click the “Information” icon to view the FITS header.
Step 3. Analysis Tools
The Portal feature enables a variety of basic image analysis tools.
3.1. Extract Pixel Values along a Line (i.e., the 1D Brightness Profile of A Source). Click the “Tools” icon, then select the “Line” icon under the “Extract” section. An instruction window will appear, allowing you to choose an aperture to combine the values. Click on the start point of the image and drag to the end point to draw a line along your source. Once the line is drawn, a pop-up window will display the 1D brightness profile. You can also adjust the aperture in this window as needed. To save the result temporarily, click the “Pin Chart/Table” button at the bottom left. This will add the table and chart next to the default results table and the active chart. Alternatively, you can download them directly. Repeat the process to add another line.
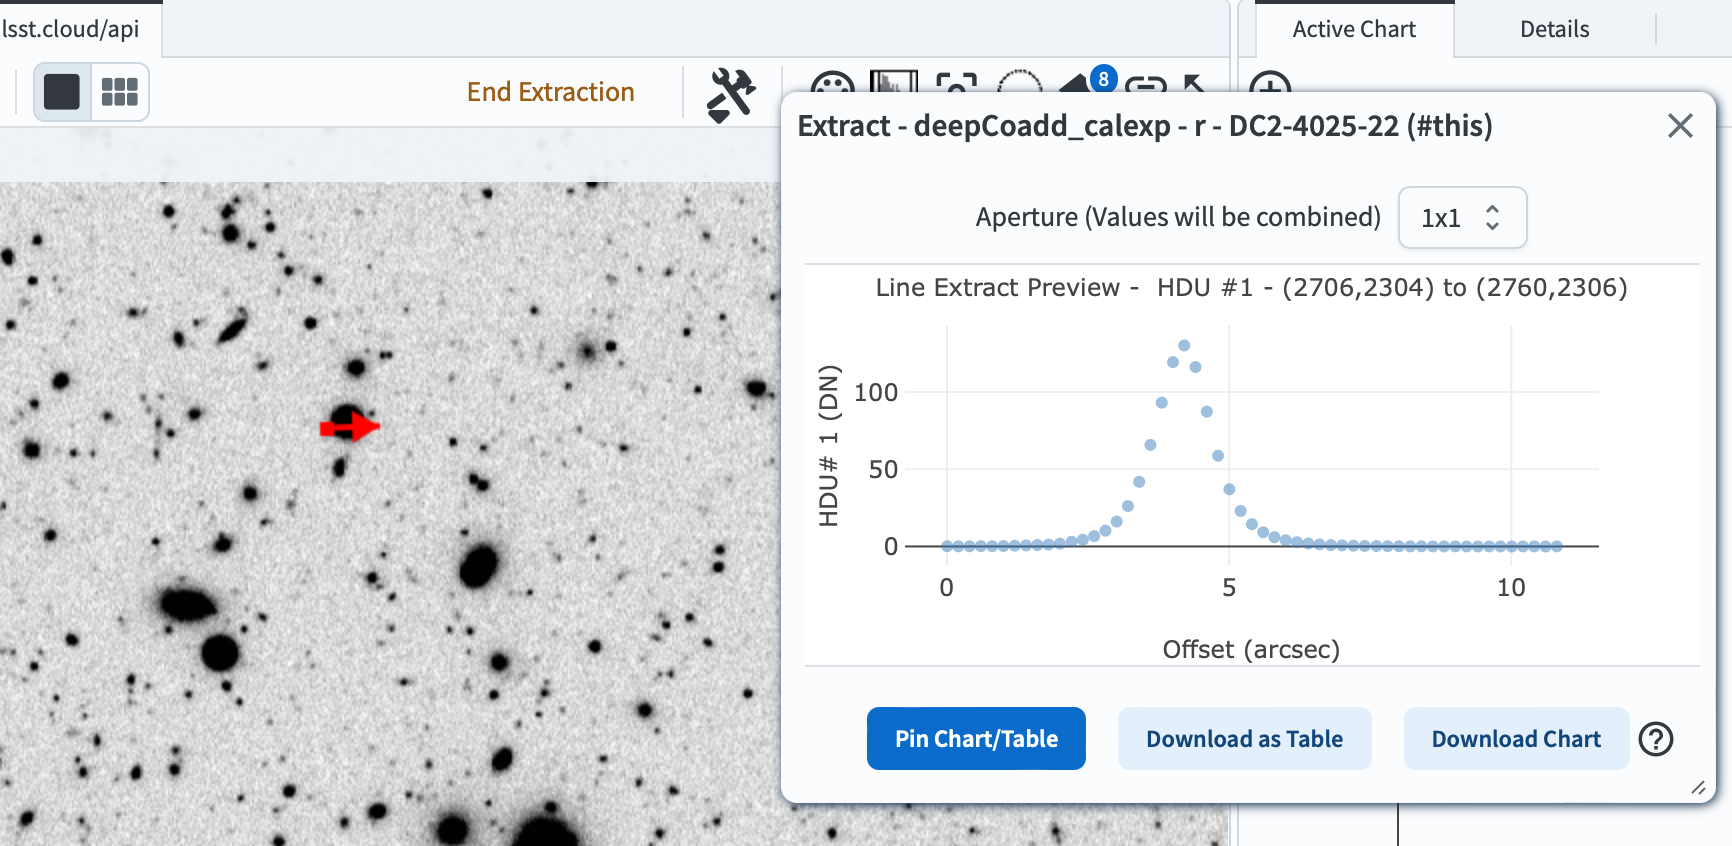
Figure 9: A line drawn across a source, with a pop-up window displaying the 1D brightness profile of the source.
3.2. Extract Pixel Information for Selected Points and Save as A DS9 Region File. Now under the “Extract” section, click the “Points” icon. An instruction window will appear, allowing you to choose an aperture to combine the values. Unlike the line extraction process, multiple points can be selected to extract their pixel values at once. To save the result temporarily, click the “Pin Chart/Table” button. Or, to save the results, click the “Download as Table” and/or “Download Chart” button. Note that the results can be saved as a DS9 region file.
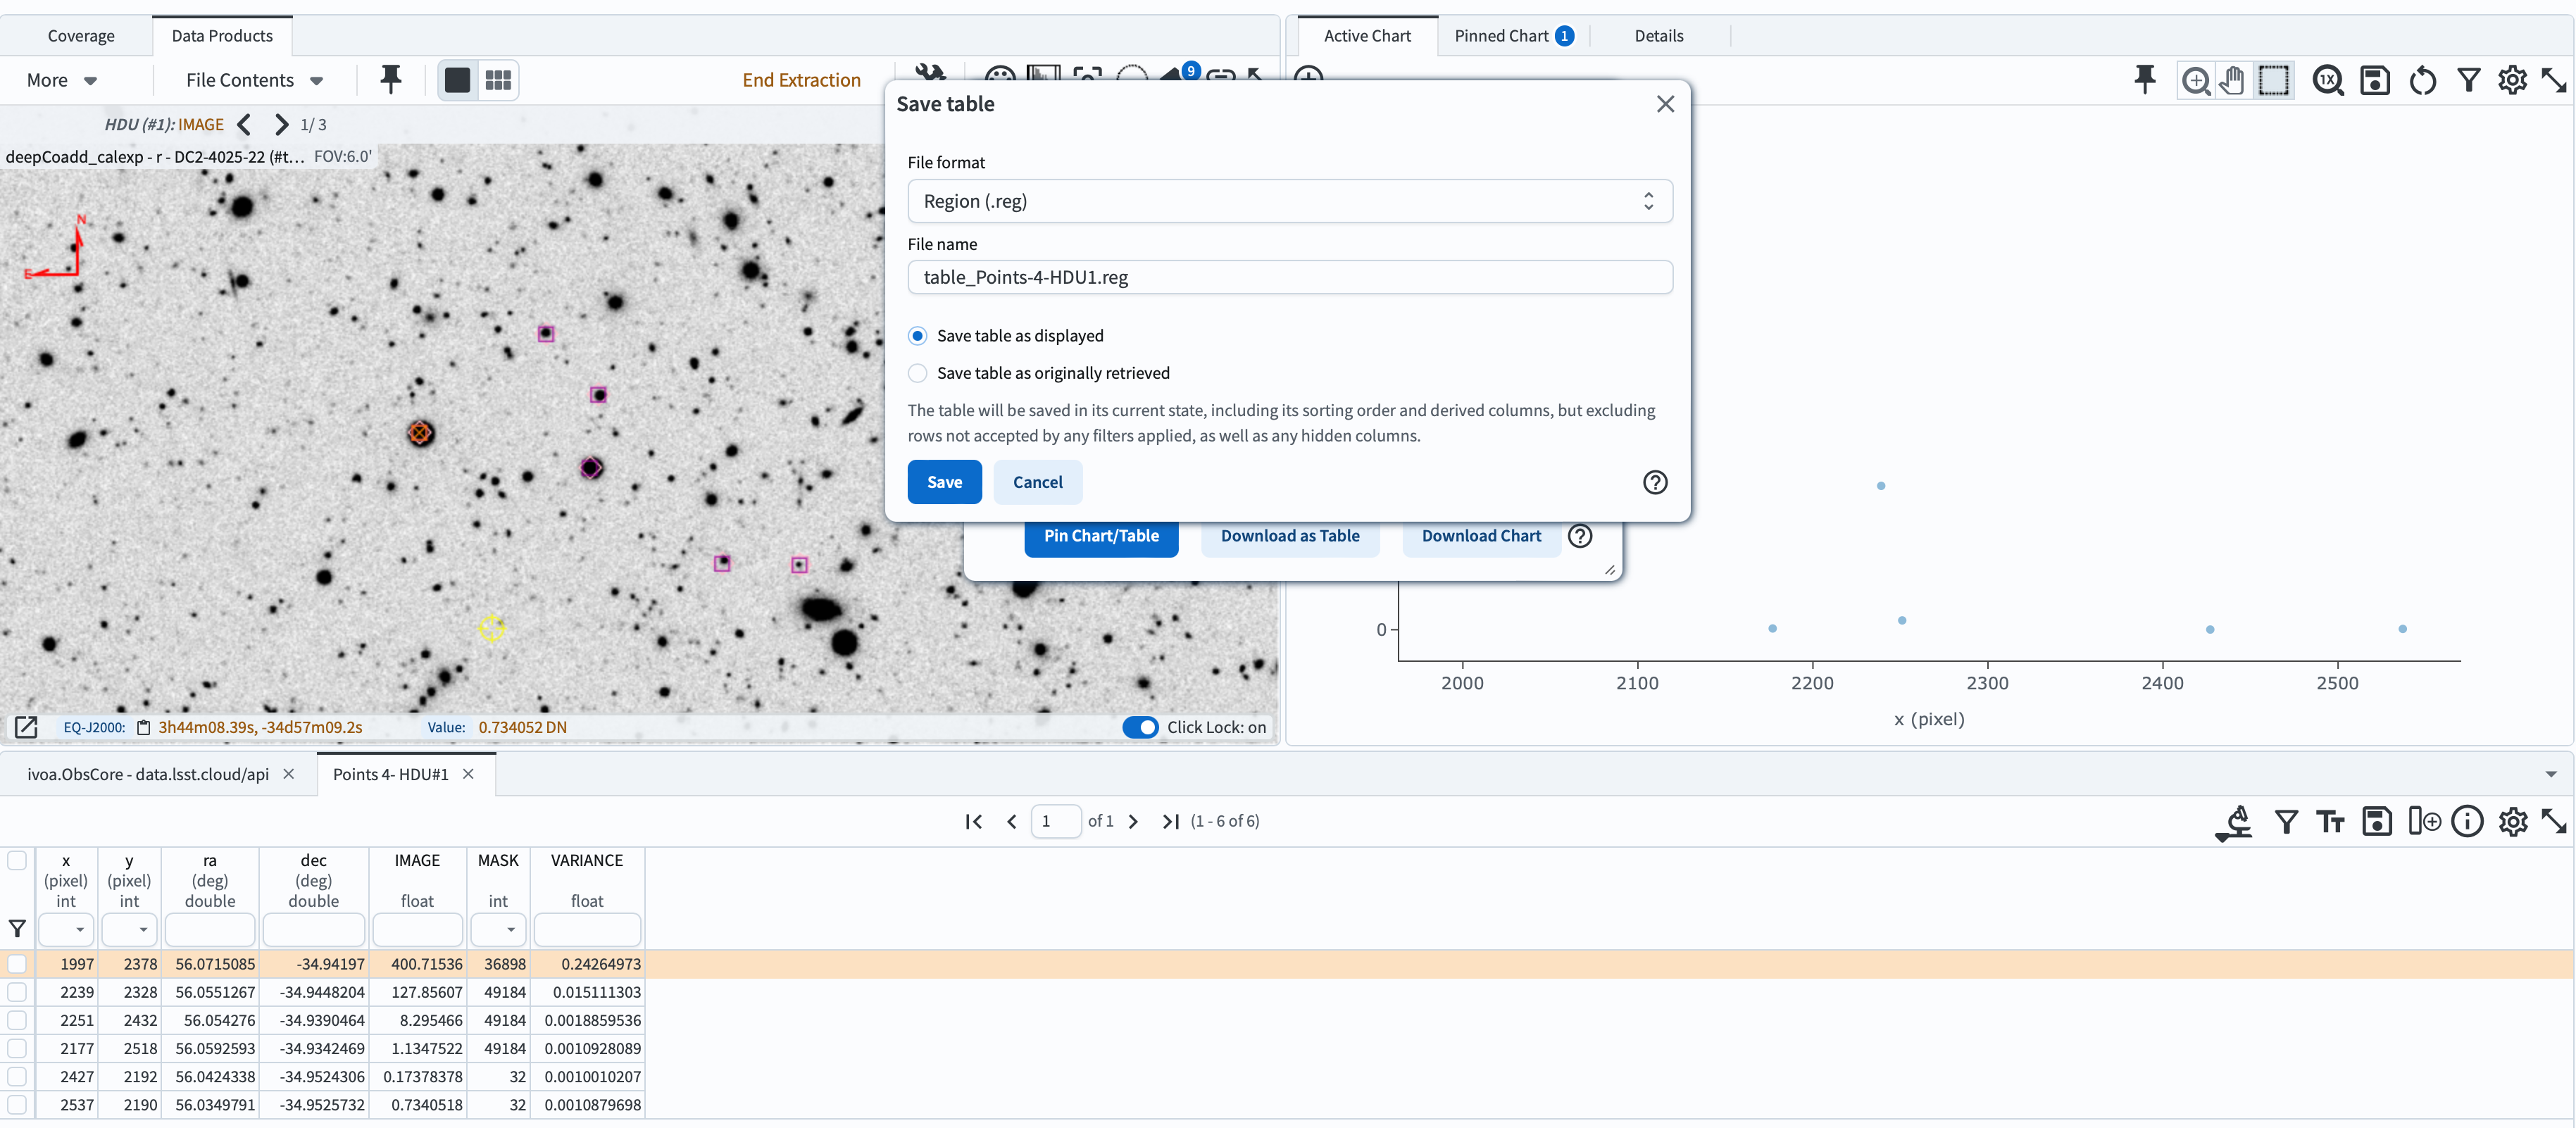
Figure 10: Six selected points on the image (left panel), in the active chart (right panel), and in the pinned table (bottom panel), with a pop-up window offering options for file format and naming for saving.
3.3. TAP Search for a Selected Source.
3.3.1. Select a Source to Execute TAP Search. Select a source to run a TAP query against the DP0.2 catalogs by following Step 3.2. In the Table view panel, click the “Lamp” icon (magenta circle) at the top right, then choose “Search TAP at row” under the “Cone and Point Actions based on center” to section.
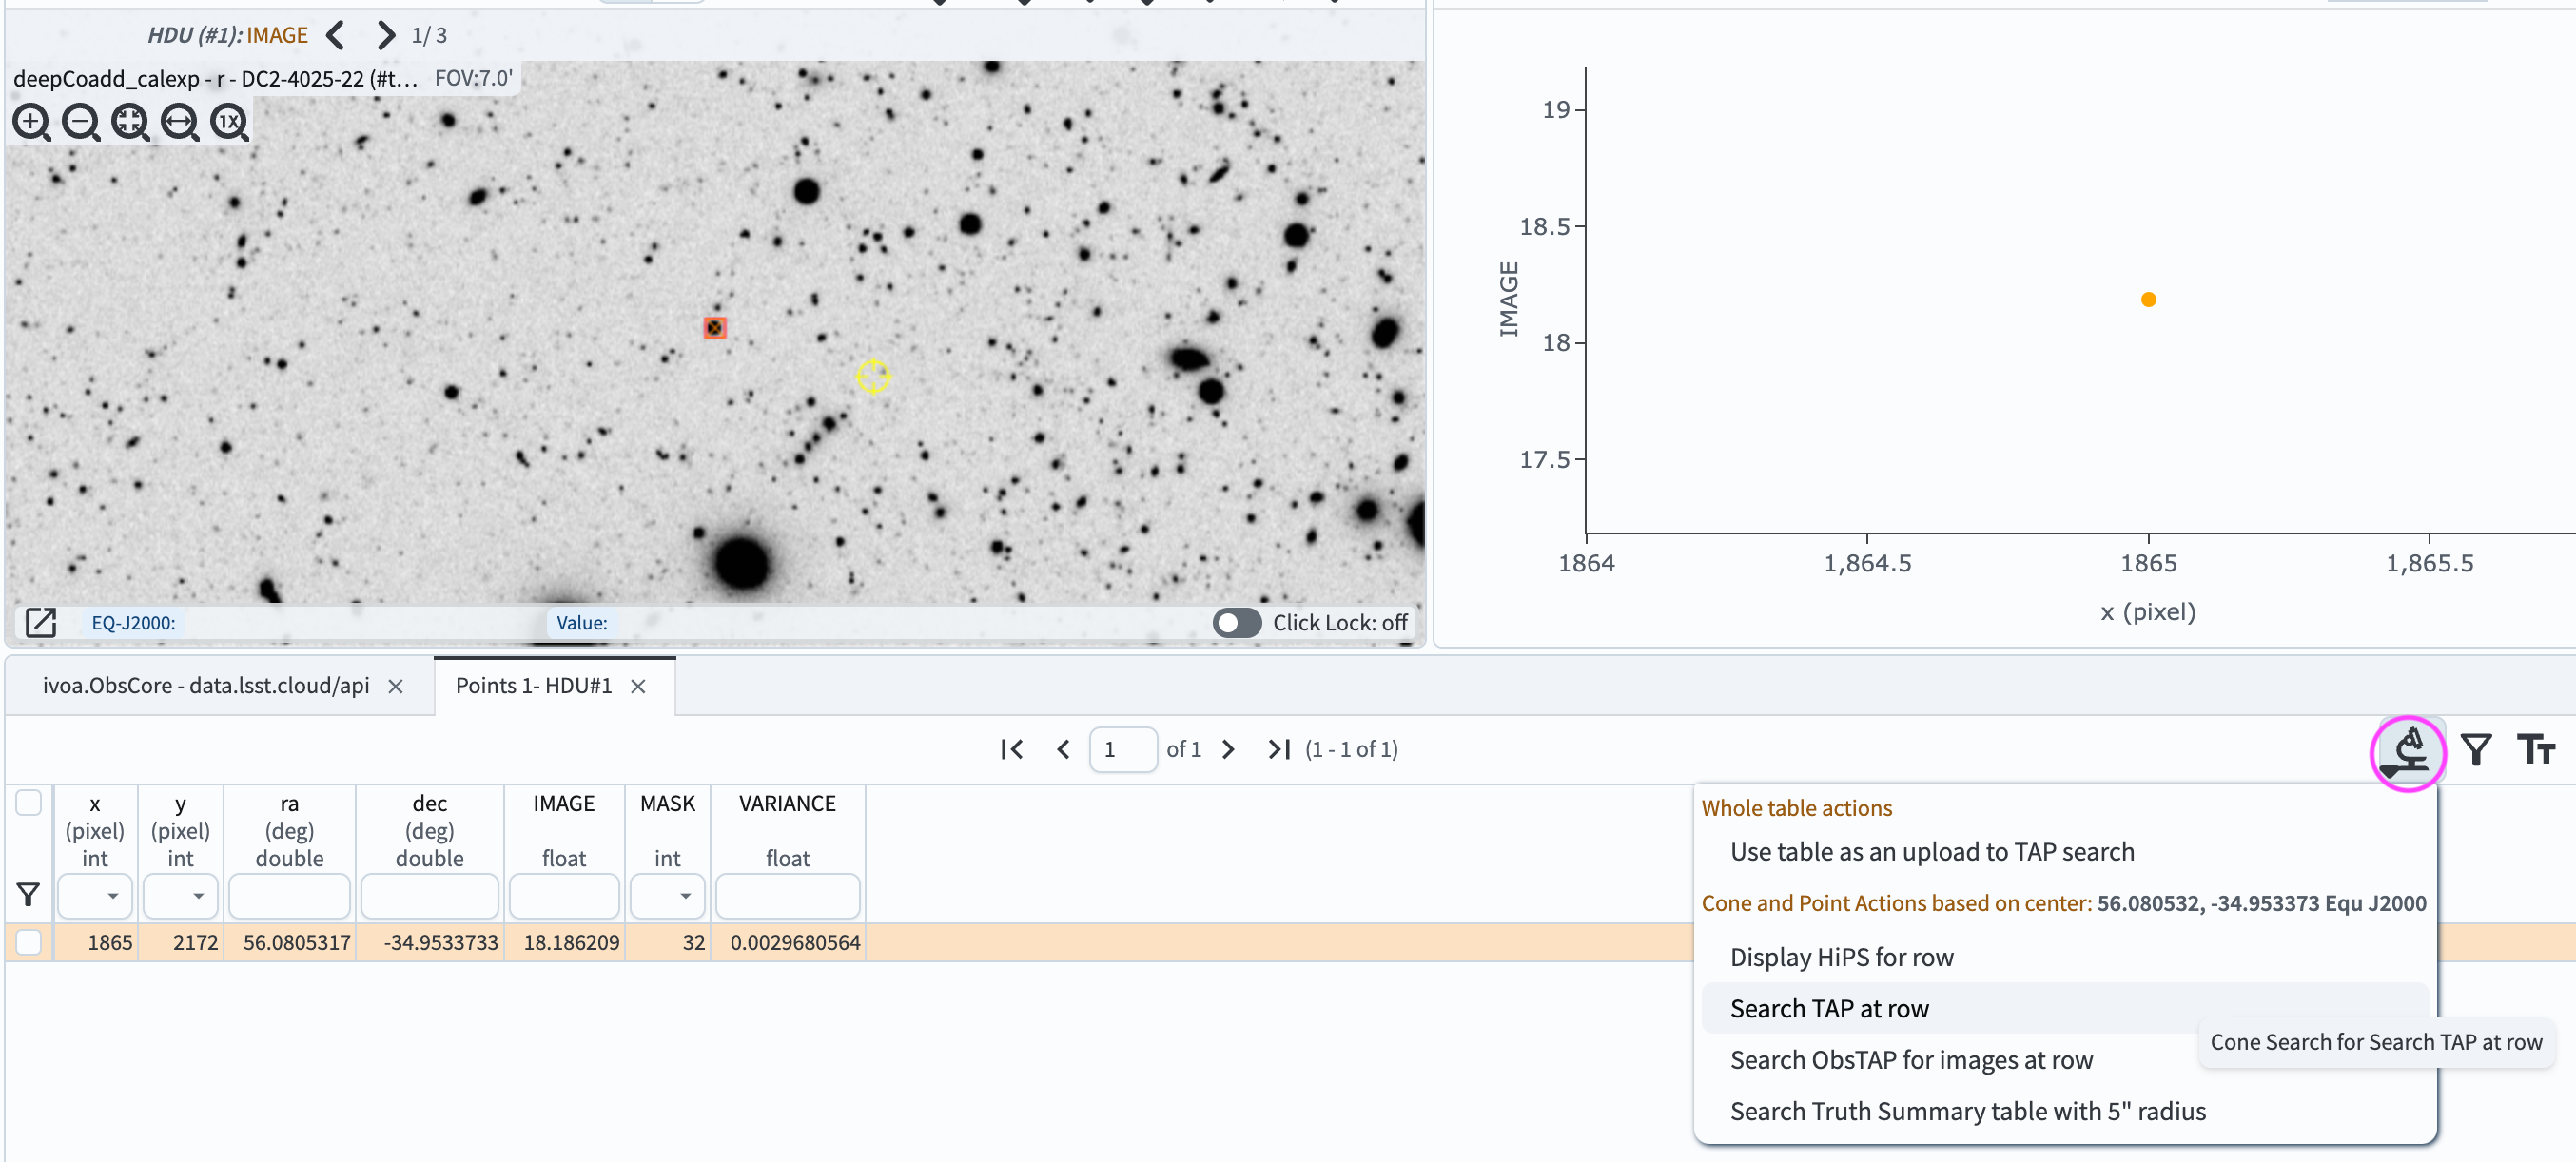
Figure 11: A screenshot showing a selected point on the image (left panel), displayed in the active chart (right panel) and pinned table (bottom panel), with a pop-up window offering TAP search options based on the selected table.
3.3.2. Execute a TAP query. Step 3.3.1 leads to the General TAP page. Ensure the TAP Service tab
at the top is set to “LSST DP0.2 DC2: https://data.lsst.cloud/api/tap”. For the “LSST DP0.2 DC2 Tables” tab,
select “dp02_dc2_catalogs.DiaSource” in the right-hand tab to retrieve flux variation data for the selected object.
Confirm the coordinate box under the “Spatial” section defaults to “3h44m19.33s -34d57m12.1s Equ J2000”.
Change the search radius to 1 arcsecond. Leave the “Temporal” box unchecked. Click the “Search” button at the bottom left.
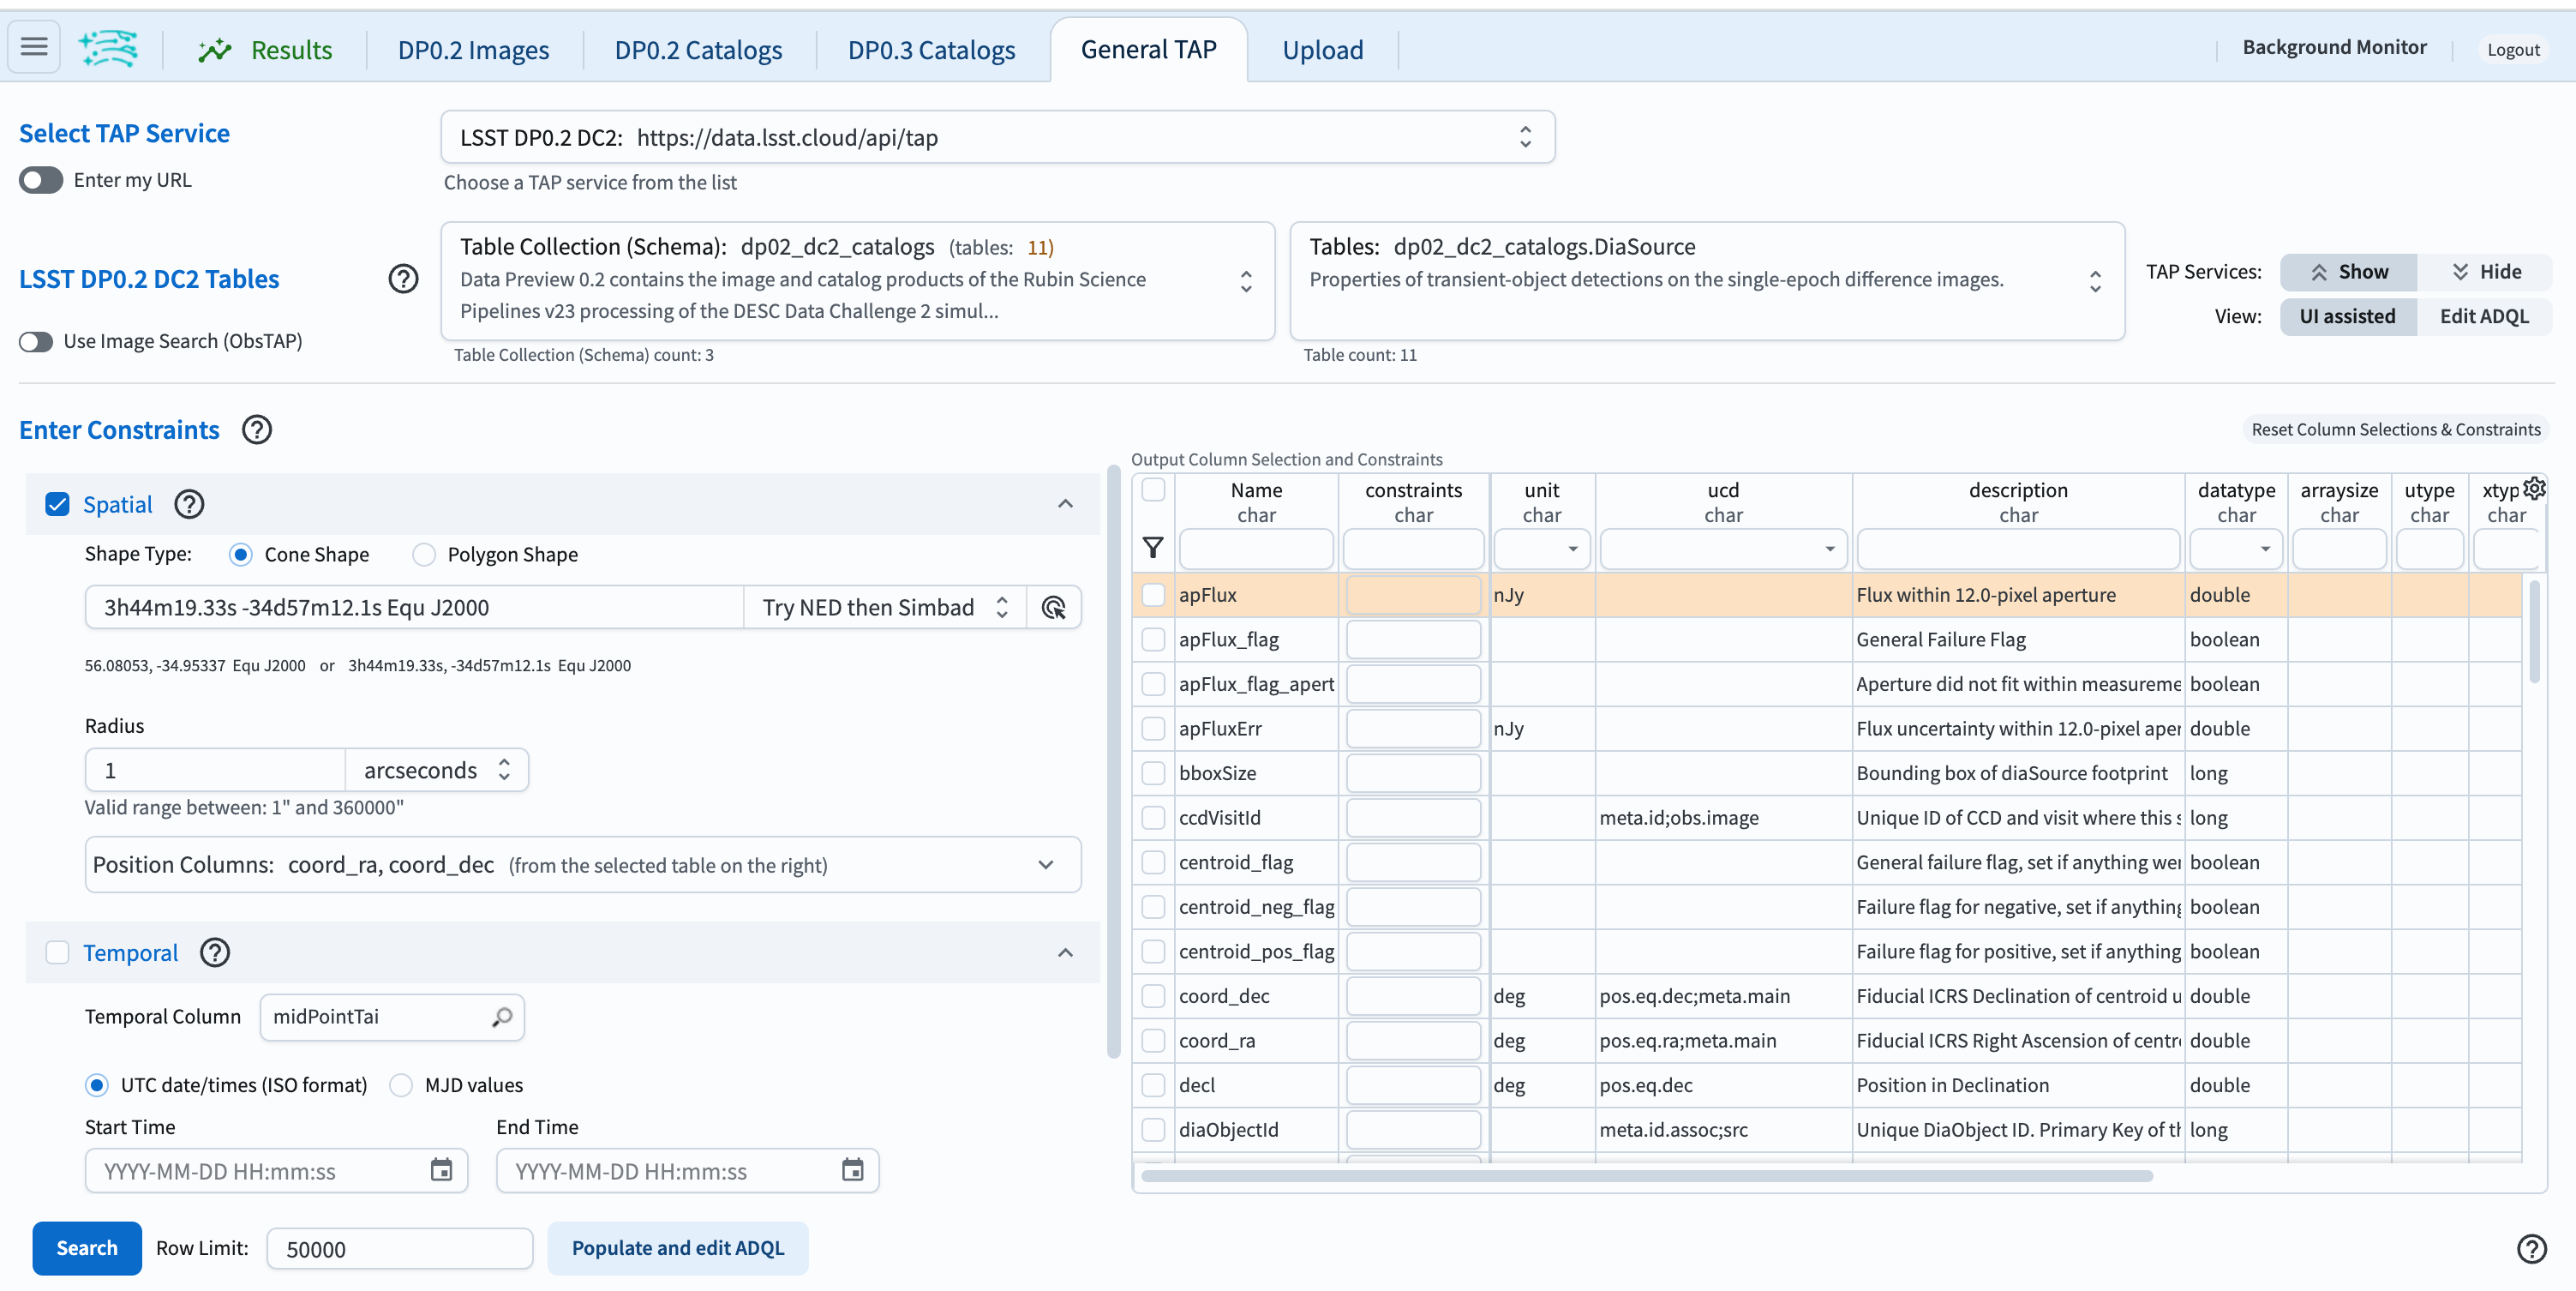
Figure 11: The General TAP page with the “dp02_dc2_catalogs.DiaSource” catalog selected, pre-populated coordinates for the selected source, and the search radius set to 1 arcsecond.
3.3.3. Plot Flux vs. Time from the TAP Query Results. Step 3.3.2 automatically leads to the Results page. Once the search is complete, the Active Chart and Table panels will display the default view of the retrieved query results with 156 entries. Ensure that “diaObjectId” equals “1735002960351461445” for all entries. To plot the object’s flux variation over time, click the “+” button in the Active Charts panel. In the “Add New Chart” window, set “X” to “midPointTai” and “Y” to “apFlux.” Toggle the y-axis “Error” and set it to “apFluxErr”. Click “OK” to generate the plot showing flux variation over time for the object.
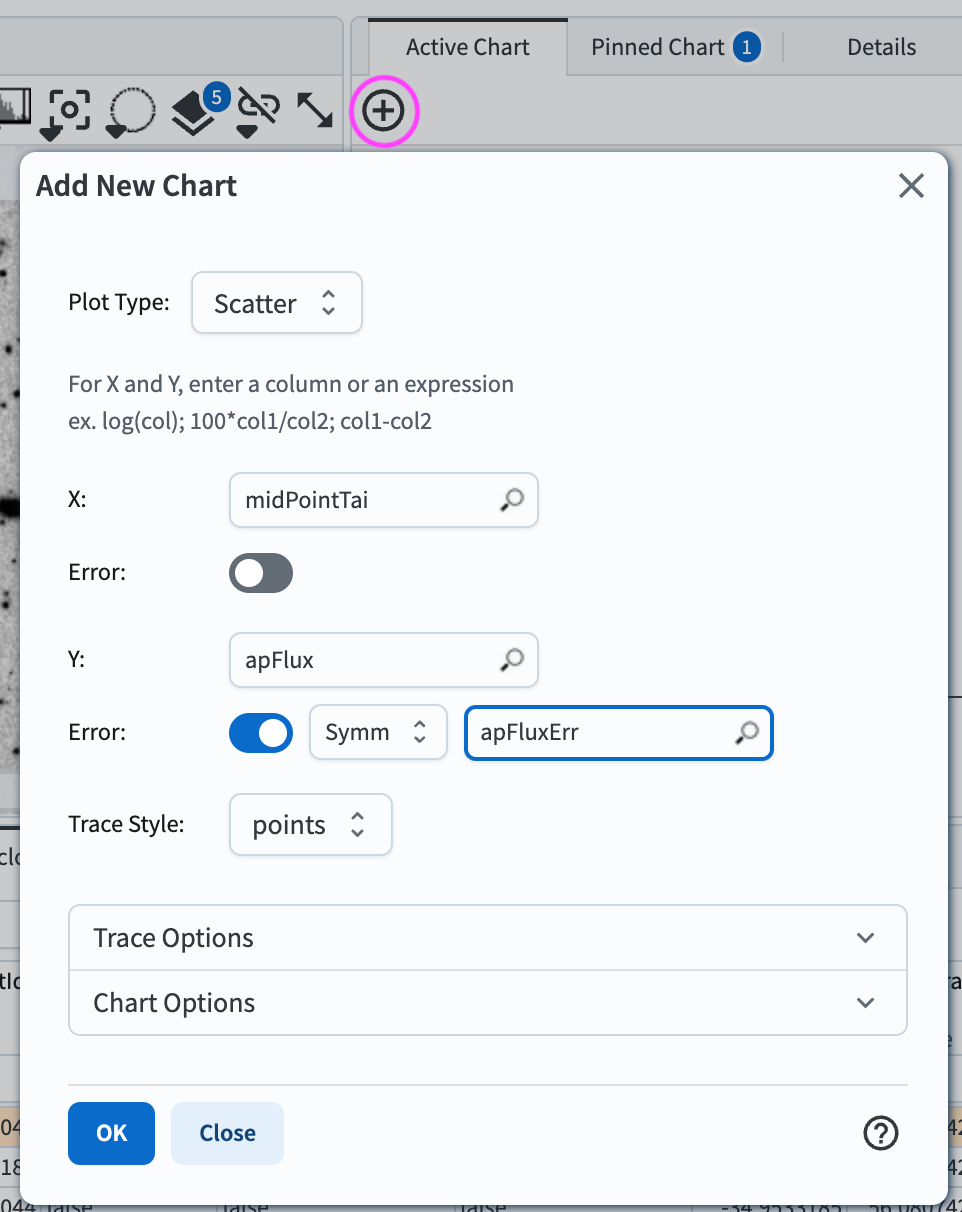
Figure 12: The “Add New Chart” pop-up window with settings to plot the object’s Flux vs. Time.
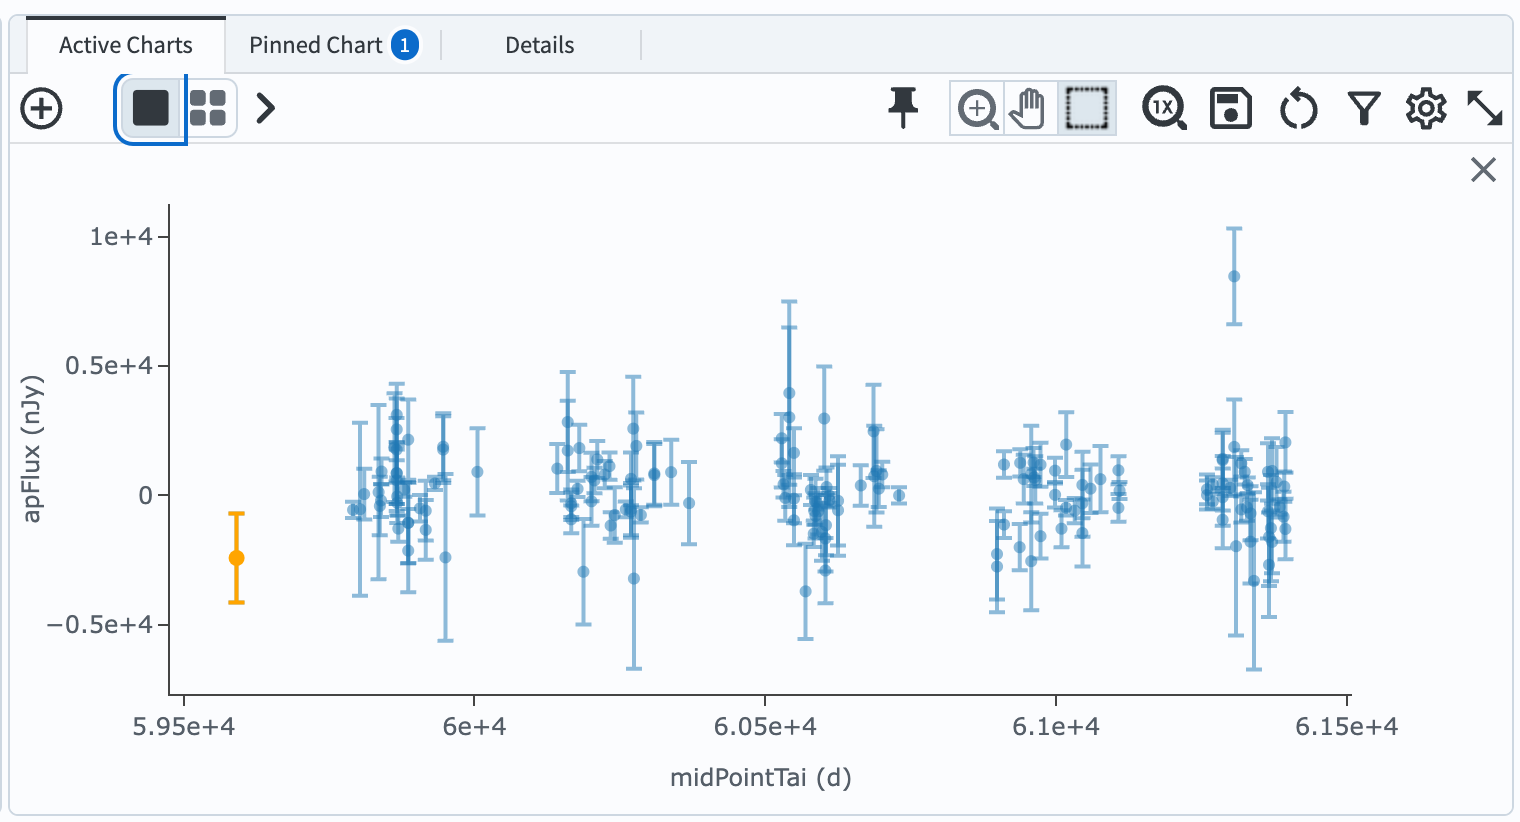
Figure 13: The flux versus observing time for the selected object.
Step 4. Exercises for the learner
4.1. Load various layers onto the images of your selected area of interest, including a DS9 region file.
4.2. Download a table of multiple extracted objects and upload it to perform a TAP search against the user-supplied tables. Refer to the available tutorials for detailed instructions on using the Portal and Jupyter Notebooks.