07.1. How to customize the results coverage chart
RSP Aspect: Portal
Contact authors: Greg Madejski and Melissa Graham
Last verified to run: 2025-02-04
Targeted learning level: intermediate
Introduction: This tutorial demonstrates how to customize the coverage chart and HiPS map panel in the Portal results tab.
1. Execute a query. Go to the Portal’s DP0.2 Catalogs tab, switch to the ADQL interface, and execute the query below. This query will retrieve a small sample of point-like objects (stars) brighter than 25th magnitude (as in preceding tutorials).
SELECT coord_dec, coord_ra, detect_isPrimary, refExtendedness,
       u_cModelFlux, g_cModelFlux, r_cModelFlux,
       i_cModelFlux, z_cModelFlux, y_cModelFlux
FROM dp02_dc2_catalogs.Object
WHERE CONTAINS(POINT('ICRS', coord_ra, coord_dec),
      CIRCLE('ICRS', 62, -37, 0.167)) =1
      AND (detect_isPrimary =1 AND refExtendedness =1
           AND u_cModelFlux >360 AND g_cModelFlux >360
           AND r_cModelFlux >360 AND i_cModelFlux >360
           AND z_cModelFlux >360 AND y_cModelFlux >360)
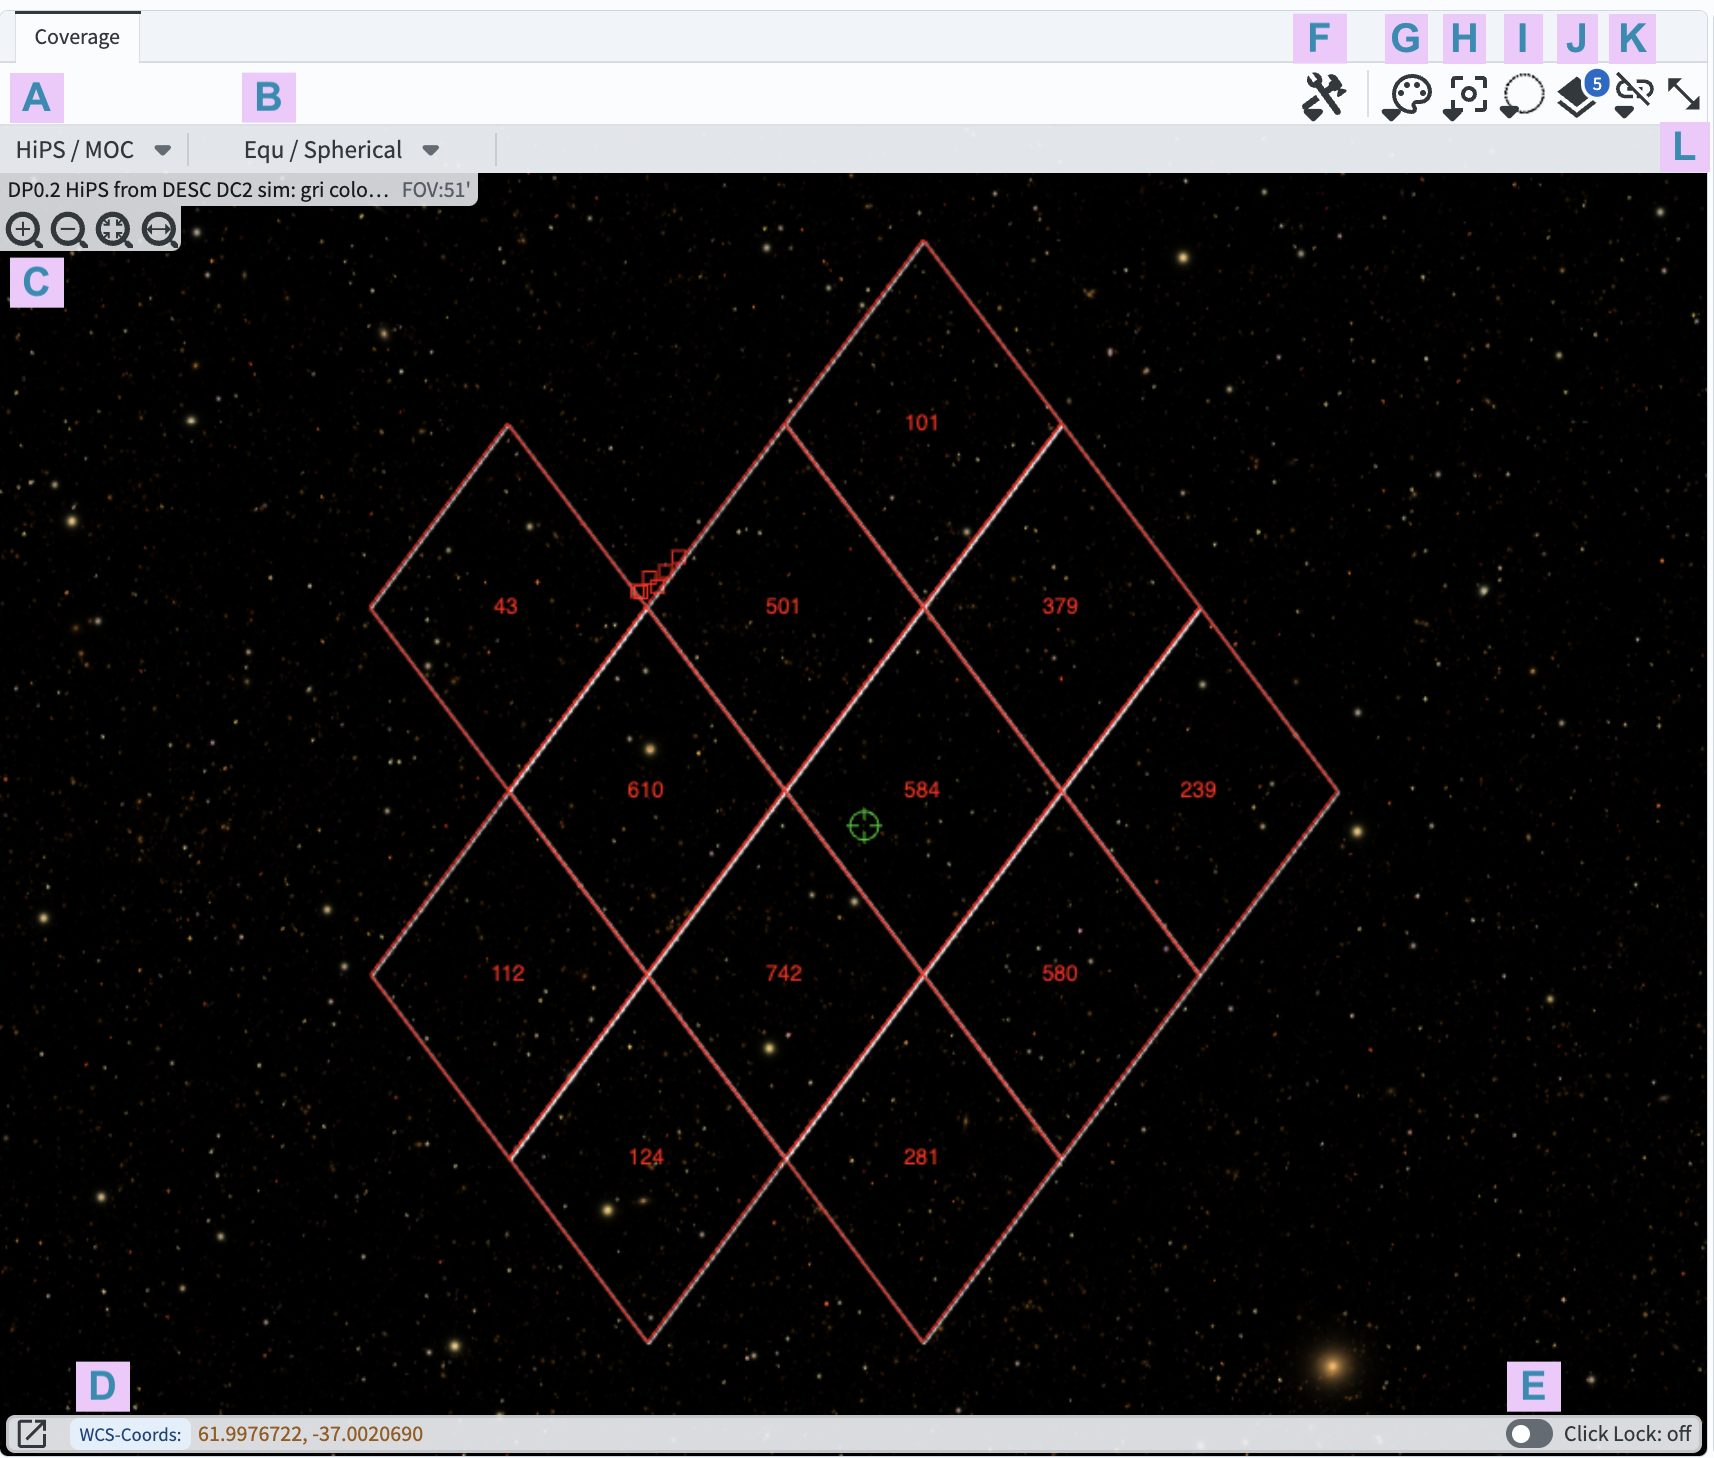
2. View the default coverage chart (Figure 1). The default view is a HEALpix grid showing the number of returned objects per grid region. Small red squares mark individual objects outside the grid. The background is a color HiPS map of the DP0.2 deeply coadded images.

Figure 1: The coverage chart panel in the Results tab, with default settings, for the query above. When the screenshot was taken the mouse was positioned on the green crosshair symbol, so the WCS Coordinates at lower left (item D) show the mouse position.
2. Change the HiPS image. Under A in Figure 1, click on “HiPS/MOC” and then “Change HiPS image”. The pop-up window offers options of color images made from different filter combinations and single-filter DP0.2 images. There is also the option of a blank background or 2MASS color images (the real 2MASS images will not match the location of the simulated DP0.2 objects). Select the DP0.2 i-band image.
3. Add a north arrow. Click on the tools icon (F in Figure 1) and in the row for Layers, select the north arrow icon (the compass with north-up, east-left). The north arrow will appear in the image.
4. Invert the color map. Click on the color palette icon (G in Figure 1) and select the color bar showing white-to-black left-to-right. The HiPS map display will be inverted and the stars will be dark on a light background.
5. Recenter on a bright star.
Click on the target icon (H in Figure 1) and enter 4h08m32.54s, -36d57m44.2s in the box.
Click “Go & Mark”.
The display will recenter on a bright star and it will be marked with a crosshair icon.
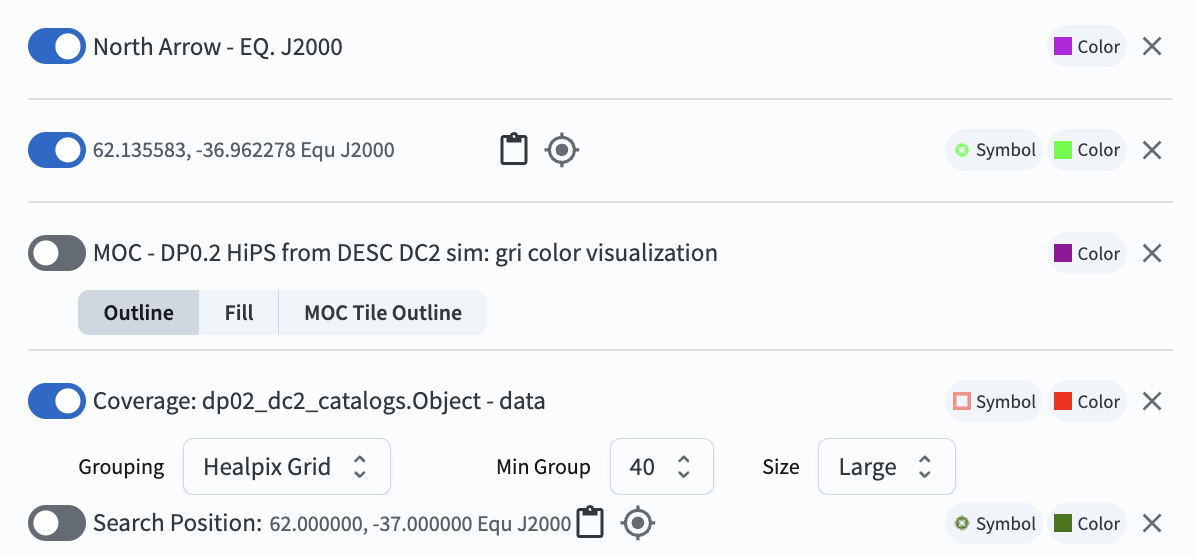
6. Manipulate the layers. Click on the layers icon (J in Figure 1). Make changes as shown in Figure 2. Change the colors of the north arrow to purple and the marked bright star to green. Under “Coverage”, next to “Min Group” select “40” from the drop down menu to change the HEALpix grid overlay. Toggle off the layer to display the central search position from the ADQL query.

Figure 2: The pop-up window to manipulate the layers, with the changes of step 9 implemented.
7. Zoom in. Above C in Figure 1, click the “zoom in” icon (magnifying glass with a + inside) three times to zoom in.
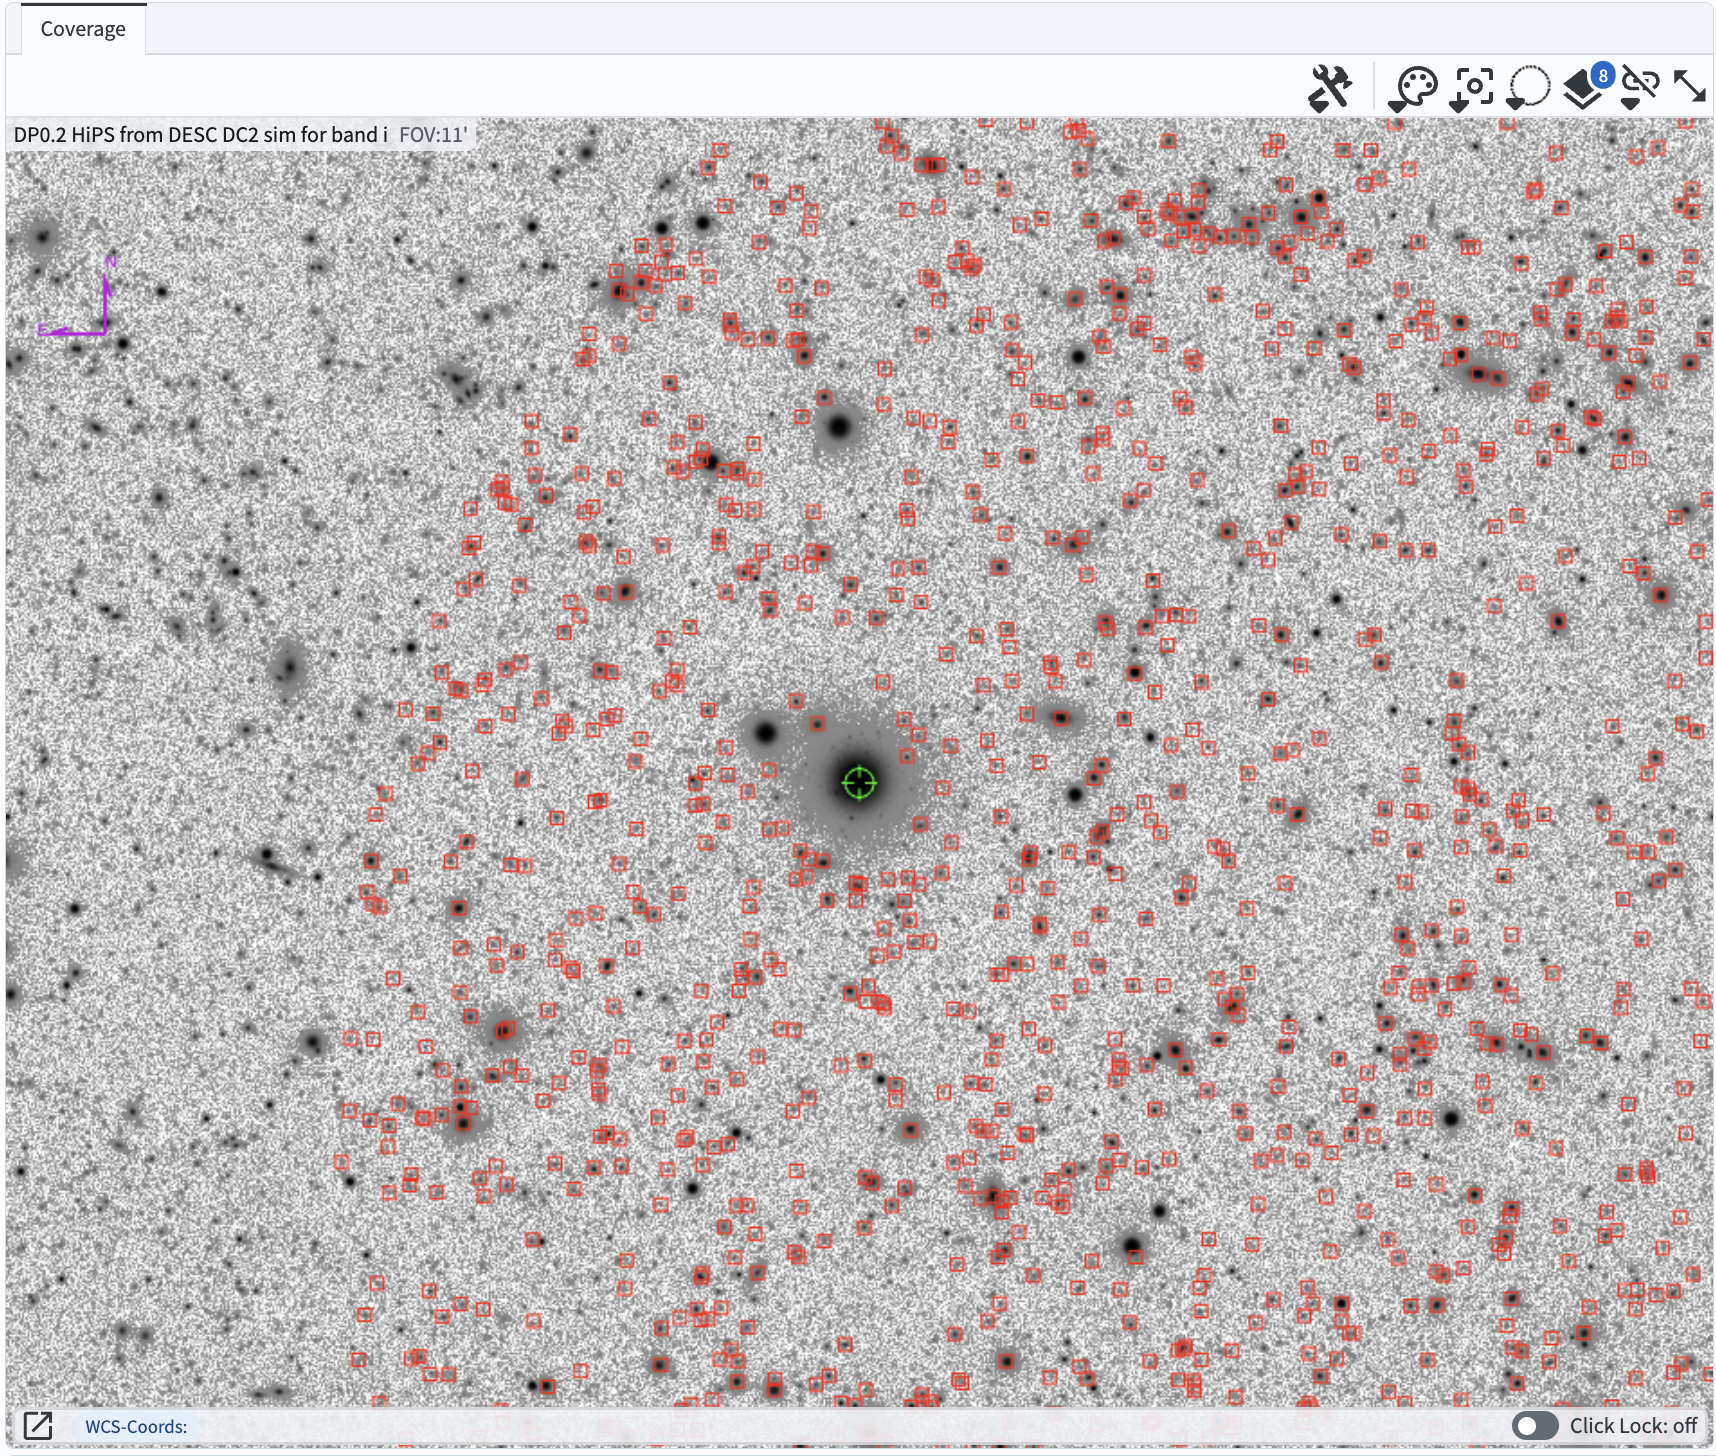
8. View the new coverage chart. It should look similar to Figure 3.

Figure 3: The coverage chart panel with modifications from steps 2, 3, 4, 5, 6, and 7 applied.
9. Reset the coverage chart. Click on the tools icon (F in Figure 1) and select the circular arrow icon next to “Save…” to restore to default options.
Return to the list of DP0.2 Portal tutorials.